Figures & data
Figure 1 (a) Total fertility and (b) life expectancy at birth in Spain: observed 2000–20 and projected to 2030 according to five scenarios
Notes: The projection of demographic components ends on 31 December 2030. The INE projection category corresponds to the medium scenario of the 2020 projection.
Source: INE and authors’ projections.
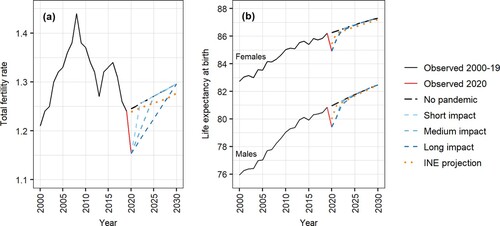
Figure 2 (a) Emigration and (b) immigration in Spain: observed 2000–20 and projected to 2030 according to five scenarios
Notes: The projection of demographic components ends on 31 December 2030. The INE projection category corresponds to the medium scenario of the 2020 projection. Two sources of observed migration counts were included in the charts (Residential Variation Statistics (EVR) and Migration Statistics (EM) (see Method section for more details)).
Source: As for .
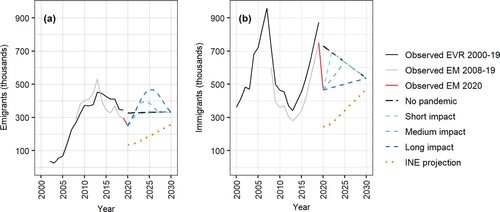
Figure 3 (a) Observed and expected (No pandemic) values of demographic components in 2020 and (b) difference between observed and expected values in 2020, Spain
Source: As for .
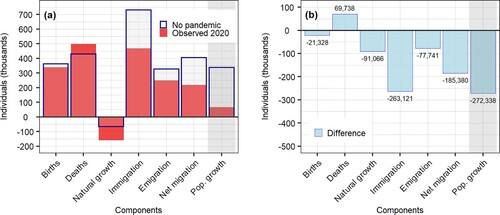
Figure 4 Immigrants, emigrants, and deaths by age and sex in Spain: observed and expected (No pandemic) in 2020
Source: As for .
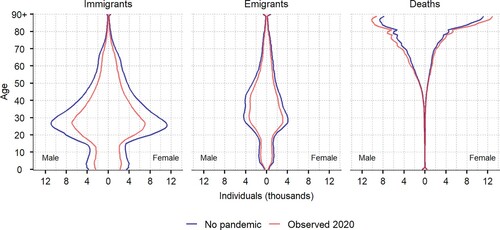
Figure 5 (a) Births, (b) deaths, (c) natural growth, and (d) net migration: demographic components in Spain, observed 2000–20 and projected to 2030 according to five scenarios
Notes: The projection of demographic components ends on 31 December 2030. The INE projection category corresponds to the medium scenario of the 2020 projection.
Source: As for .
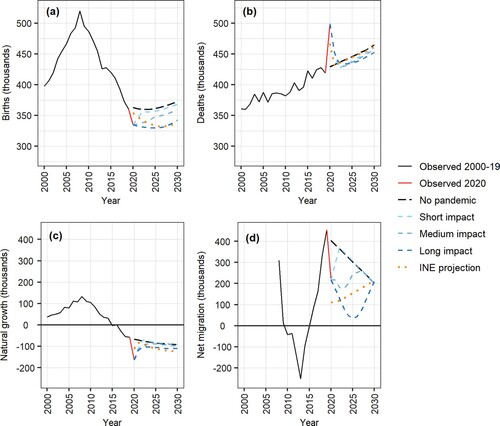
Figure 6 Observed population 2000–21 (January 1) and projected to 2031 (January 1) according to five scenarios, Spain
Notes: The population projection ends on 1 January 2031, while the projection of the demographic components ends on 31 December 2030. The INE projection category corresponds to the medium scenario of the 2020 projection.
Source: As for .
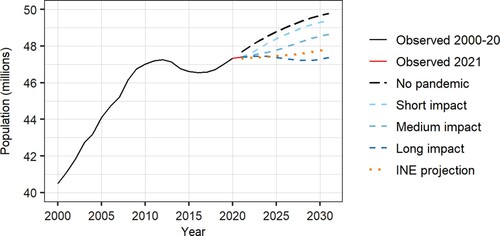
Figure 7 (a) Ageing Index, (b) double ageing ratio, and (c) total dependency ratio: observed 2020–21 (January 1) and projected to 2031 (January 1) according to five scenarios, Spain
Notes: The population projection ends on 1 January 2031, while the projection of the demographic components ends on 31 December 2030. The INE projection category corresponds to the medium scenario of the 2020 projection.
Source: As for .
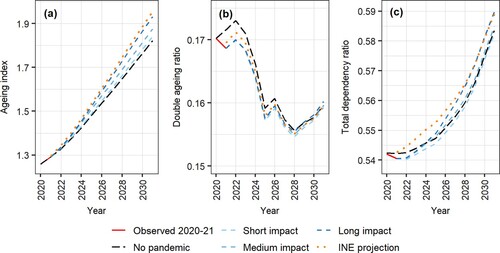
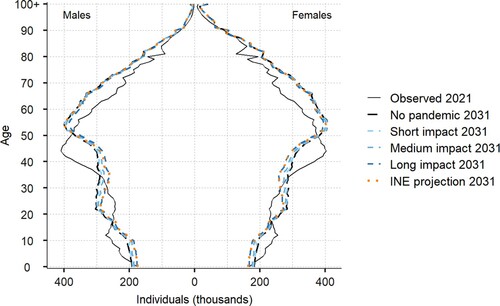
Figure 8 Population pyramid on 1 January 2021 and projected to 1 January 2031 according to five scenarios, Spain
Notes: The population projection ends on 1 January 2031, while the projection of the demographic components ends on 31 December 2030. The INE projection category corresponds to the medium scenario of the 2020 projection.
Source: As for .