
Figures & data
Figure 1 (a) Crude divorce rate in Sweden and (b) three-year moving average of crude divorce rate in Västerbotten County, 1911–2019
Source: Statistics Sweden (Citation1911, Citation1963, Citation1967, Citation2022).
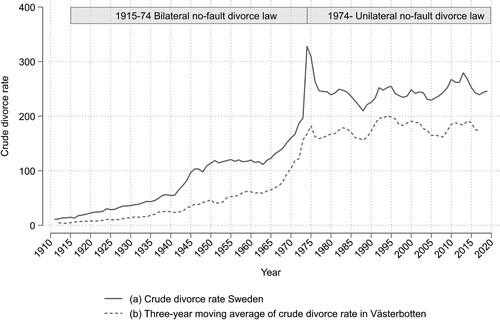
Figure 2 Study area in Västerbotten County
Source: Demographic Data Base, Umeå University.
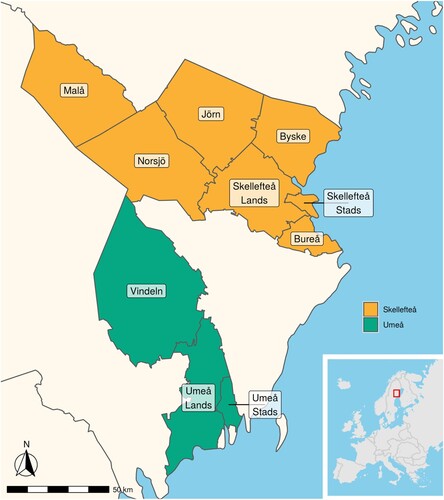
Table 1 Descriptive statistics of couples in analytical sample (numbers and percentages): men and women who married in 1880–1954 in Västerbotten County, Sweden
Figure 3 Kaplan–Meier marriage survival estimates by marriage cohort as a function of time since marriage for couples married 1880–1954 in Västerbotten County, Sweden
Source: POPLINK database (Demographic Data Base, Umeå University).
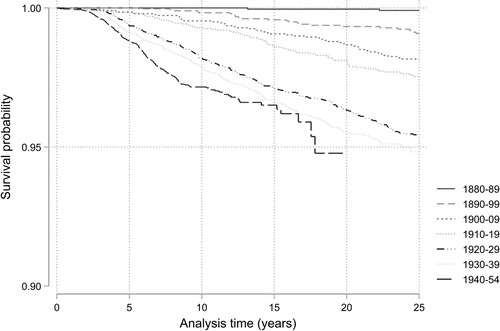
Figure 4 Kaplan–Meier marriage survival estimates by socio-economic status for men married 1880–1954 in Västerbotten County, Sweden
Source: As for .
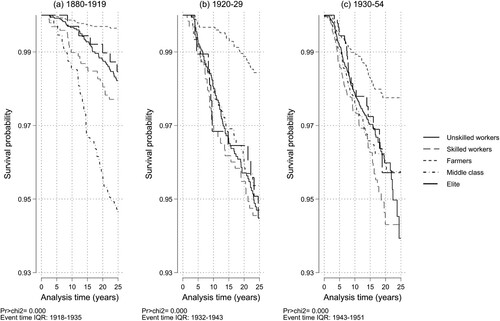
Figure 5 Kaplan–Meier marriage survival estimates by socio-economic status for women married 1880–1954 in Västerbotten County, Sweden
Source: As for .
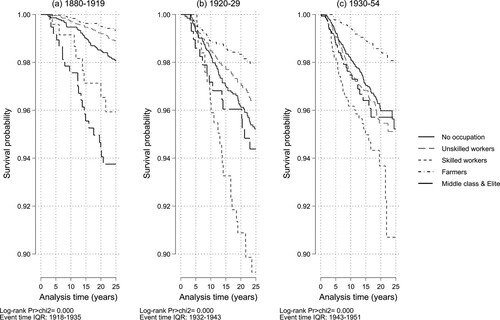
Table 2 Cox regressions: relative hazard of divorce for couples married in 1880–1954 in Västerbotten County, Sweden
Table 3 Cox regressions: relative hazard of divorce for men and women married in 1880–1954 in Västerbotten County, Sweden, including interaction between marriage cohort and SES
Table A1 Cox regressions: relative hazard of divorce for couples married in 1930–54 compared with those married in 1930–45 (i.e. under observation for a minimum of 15 years)