Figures & data
Figure 1 Monthly evolution of fertility and newborn health characteristics, Mexico, January 2016 to December 2021
Notes: The GFR is per 1,000 females of reproductive age (15–44). Other rates are per 1,000 births. Shaded area represents conceptions during the stay-at-home order. Source: Ministry of Health, Mexico.
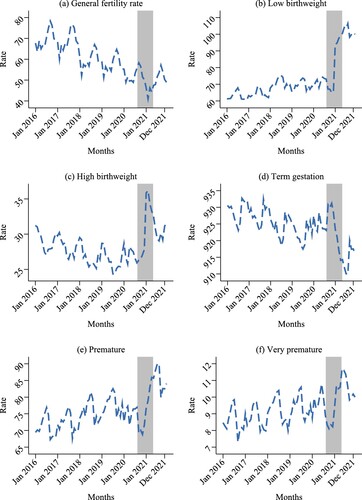
Table 1 Descriptive statistics: fertility and newborn health characteristics in Mexico, pre-Covid and Covid periods
Figure 2 Event-study results for fertility and newborn health characteristics, Mexico, 2020–21
Notes: Plotted coefficients are event-study dummy variables, βq. The event study considers 2016–to 2021, with November 2020 as the omitted period: this period represents conceptions that likely occurred in February 2020 (if carried to term). The pre-pandemic period includes January 2016 to November 2020. The pandemic period includes December 2020 to December 2021. Solid diamonds and lines represent point estimates; dotted lines display 95 per cent confidence intervals. Baseline fixed effects are included at the state, month, and year levels. Outcomes include the natural log of the GFR (per 1,000 females of reproductive age, 15–44); the remaining outcomes are the natural log of each rate per 1,000 births. Robust standard errors are clustered at the state level. Shaded area represents conceptions during the stay-at-home order. See Tables A.1–A.3 for the wild cluster bootstrapped p-values.
Source: As for .
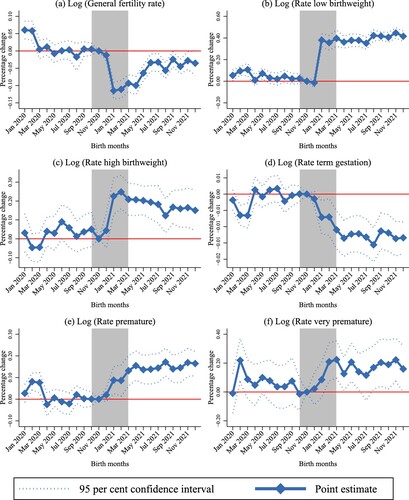
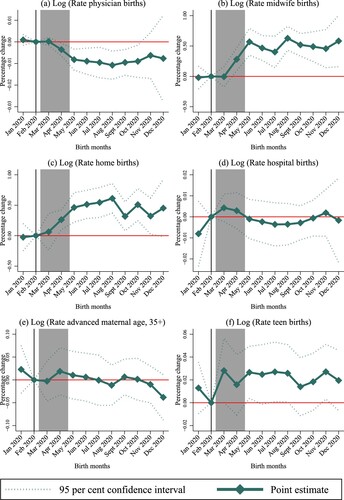
Figure 3 Event-study results by attendance, location of delivery, and maternal age, Mexico
Notes: Plotted coefficients are event-study dummy variables, βq. The event study considers 2016–to2020, with February 2020 as the omitted period (shown by the vertical line). The event study compares deliveries that occurred in 2020 against deliveries from 2016 to 2019. Solid diamonds and lines represent point estimates; dotted lines display the 95 per cent confidence intervals. Baseline fixed effects are included at the state, month, and year levels. Robust standard errors are clustered at the state level. The shaded area is the lockdown period, and the horizontal line represents zero.
Source: Ministry of Health, Mexico; INEGI (Citation2020).