Figures & data
Figure 1 Maps showing percentage of expected properties from the census frame that were actually enumerated by census workers: rural and urban areas, Colombia 2018
Notes: Left-hand panel: In rural areas, census enumeration areas in which 90 per cent or more of expected properties were enumerated during census fieldwork are shown in green, areas where 0–90 per cent were enumerated are shown in orange, and areas where no property was enumerated are shown in grey. Right-hand panel: In urban areas, colours are the same as for rural areas, but the indicator was the percentage of expected dwellings in a census enumeration area.
Source: The methodology for determining census coverage is described by DANE (Citation2022a). The image is taken from the Geovisor tool used by DANE to monitor census coverage.
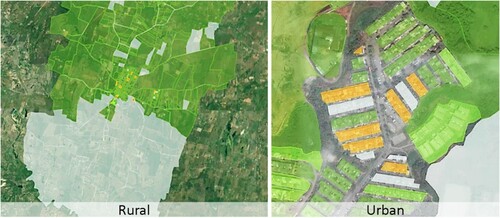
Figure 2 Maps of the study area in Colombia, 2018, showing two important predictor variables: Left-hand panel shows community-based estimates of population size in each enumeration area; Right-hand panel shows remotely sensed building coverage for 90 m pixels
Source: National boundaries were obtained from Global Administrative Areas (GADM Citation2019) and the subnational boundaries from DANE (Citation2022b). The maps were created using ESRI ArcGIS pro v.2.5. Community-based estimates of population size in each enumeration area were obtained from social cartography workshops. Remotely sensed building coverage for 90 m pixels was obtained from World Settlement Footprint 3D.
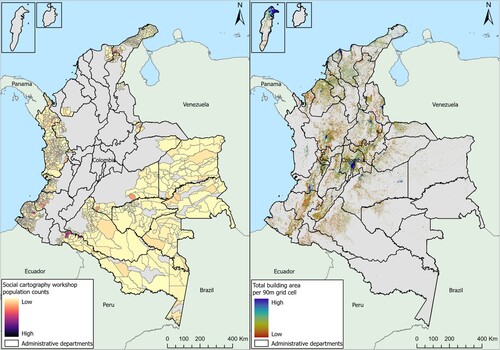
Figure 3 Directed acyclic graph (DAG) showing relationships between data (squares) and parameters (circles)
Notes: The hierarchical model structure has a sub-model to estimate counts of buildings (B) that feeds into a sub-model of population (P). Solid lines indicate stochastic relationships, while dashed lines indicate deterministic relationships. Black-filled nodes were not included in every model. Key parameters included people per building () and buildings per hectare (
). Parameters and data are defined in Tables 1 and 2.
Source: Authors’ own.
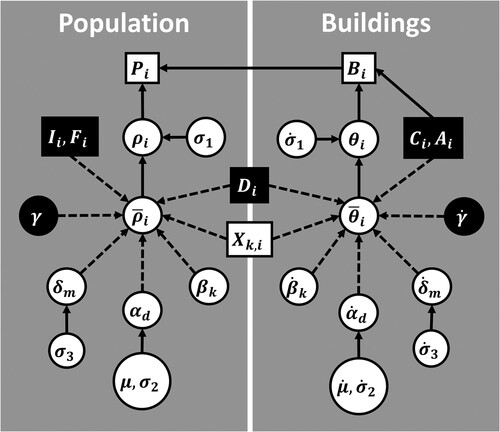
Table 1 Definitions of symbols for data
Table 2 Definitions of symbols for parameters
Figure 4 Predicted counts from the Combined model of population (left-hand panel) and building counts (right-hand panel) for all census enumeration areas where the routes method was conducted, Colombia 2018
Source: National boundaries were obtained from Global Administrative Areas (GADM Citation2019) and the subnational boundaries from DANE (Citation2022b). The maps were created using ESRI ArcGIS pro v.2.5. See Data subsection for information on data sources used to calculate values displayed in this map.
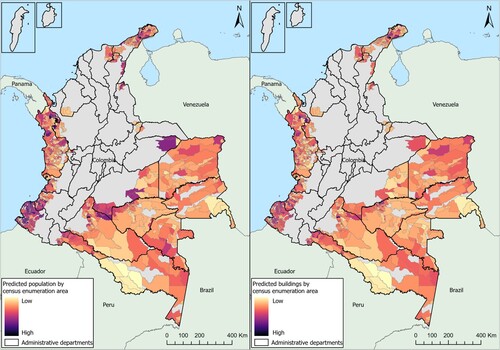
Table 3 Proportion of out-of-sample observations that were within each model’s prediction intervals
Figure 5 Comparisons of model fit across four models (Base, Satellite, Community, and Combined) for the two response variables (population and buildings) in each hierarchical model
Notes: Fit statistics were calculated using out-of-sample predictions from 10-fold cross-validations. Bias, imprecision, and inaccuracy are reported as proportions of the predicted values. R-squared values quantify the proportion of variance explained by each model. Note that x-axes do not start at zero.
Source: See Data subsection for information on data sources used to calculate values in this figure.
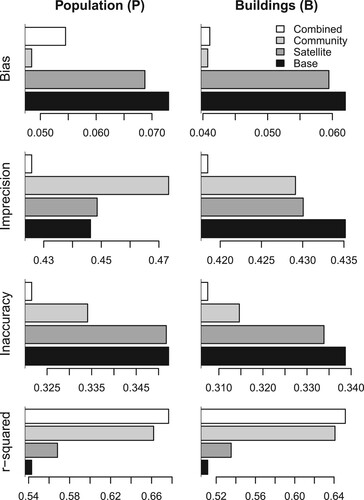
Figure 6 Model fit for the Combined model showing out-of-sample model predictions vs observed data from census enumeration areas that were fully enumerated (≥90 per cent coverage), Colombia 2018
Notes: The diagonal line is a 1:1 relationship where predictions are equal to observations. Vertical lines show 95 per cent prediction intervals.
Source: See Data subsection for information on data sources used to calculate values in this figure.
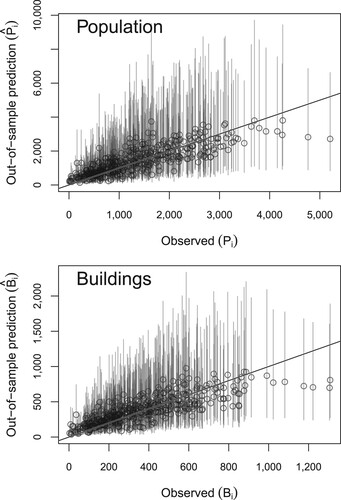
Figure 7 Covariate effects ( and
) on the expected values of buildings per hectare (
) or buildings per built hectare (
) for all four models, Colombia
Notes: Covariates are defined in the Methods section and Table 1: Schools (x1), Poverty (x2), Elevation (x3), NightLights (x4), DistToCenter (x5), and Area (x6). BldgCover refers to building coverage.
Source: See Data subsection for information on data sources used to calculate values in this figure.
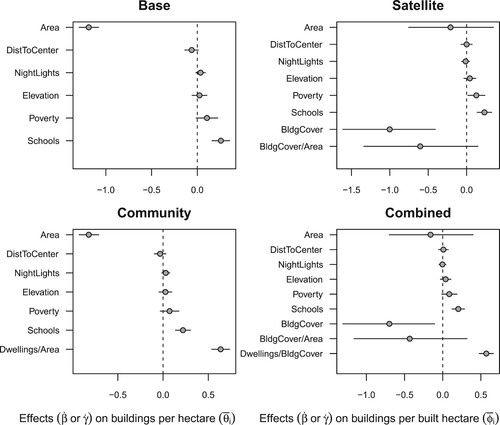
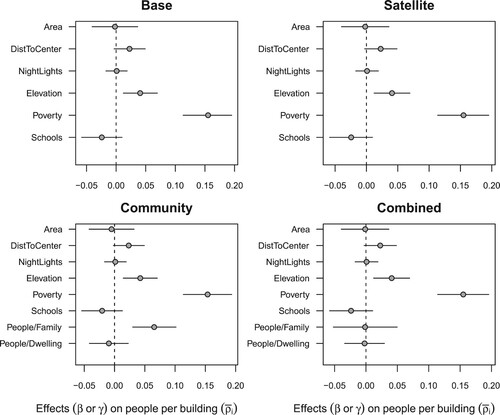
Figure 8 Covariate effects ( and
) on the expected values of people per building (
) for all four models, Colombia
Notes: Covariates are defined in the Methods section and Table 1: Schools (x1), Poverty (x2), Elevation (x3), NightLights (x4), DistToCenter (x5), and Area (x6).
Source: See Data subsection for information on data sources used to calculate values in this figure.