Figures & data
Figure 1 Relative crude birth rate (CBR) in 1918, 1919, and 1920 in seven neutral European countries (Spain, Iceland, Denmark, Norway, the Netherlands, Switzerland, and Sweden) and three belligerent European countries (Germany, Hungary, and France), using 1915–17 as a baseline
Source: Data used come from the Human Mortality Database (Citation2023) and Jónsson and Magnússon (Citation1997) for Iceland and from Chesnais (Citation1992) for the other countries.
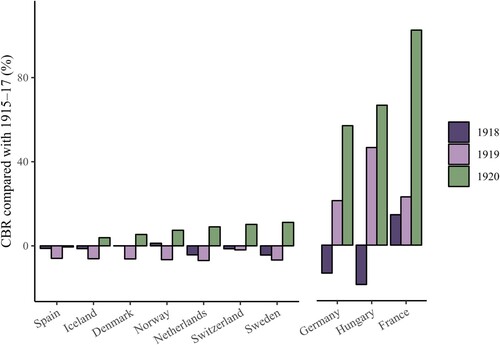
Figure 2 Correlation of relative subnational birth counts (anomalies) in 1919 and 1920 in Norway, Sweden, Denmark, the Netherlands, Switzerland, and Spain, using 1916–18 as a baseline
Source: See supplementary material for detailed information on data sources.
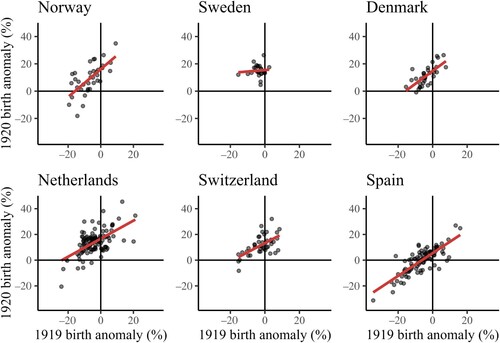
Figure 3 Cohort-specific fertility rate (CSFR) anomaly per woman in 1919 and 1920 in Norway, Sweden, and Denmark (using 1916–18 as a baseline) and net anomaly over 1919–20
Source: Data used come from the Human Fertility Database (Citation2023) and Brunborg and Mamelund (Citation1994).
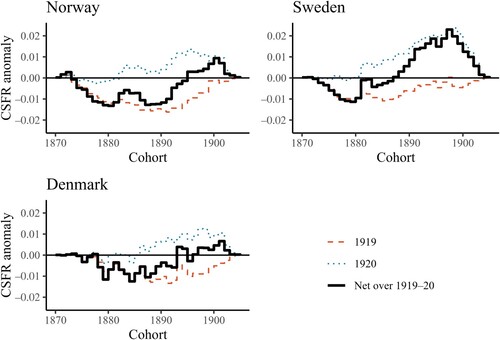
Figure 4 Relative crude birth rate (CBR) in 1920 in a range of non-European and neutral European countries, using 1915–17 as a baseline
Source: Data used come from Chesnais (Citation1992), International Historical Statistics (Palgrave Macmillan Citation2013), Verropoulou (Citation1997), and Kim (Citation1966).
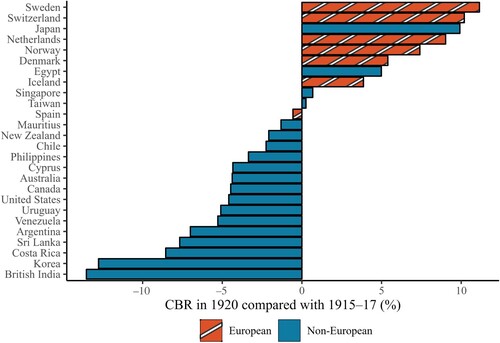
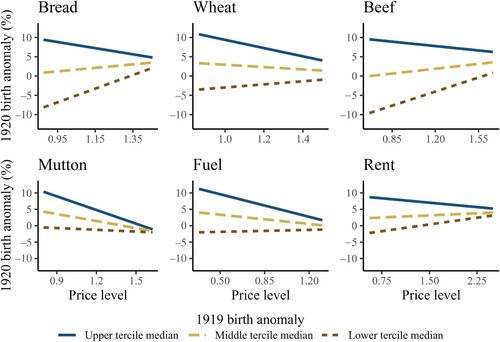
Figure 5 Interaction plots showing the linearly predicted value of the local 1920 relative birth anomaly in Spain (using 1916–18 as a baseline) based on the change in the price of bread, wheat, beef, mutton, fuel, and rent from winter 1918–19 to winter 1919–20 and different levels of 1919 relative birth anomaly
Source: See supplementary material for detailed information on data sources.