
Figures & data
Figure 1 Weekly admissions to the lazzaretto: Carmagnola 1630–31
Note: Week 1 begins on 3 May 1630; week 57 ends on 5 June 1631.
Source: See Historical context, data, and methods section; and replication package (Note 3).
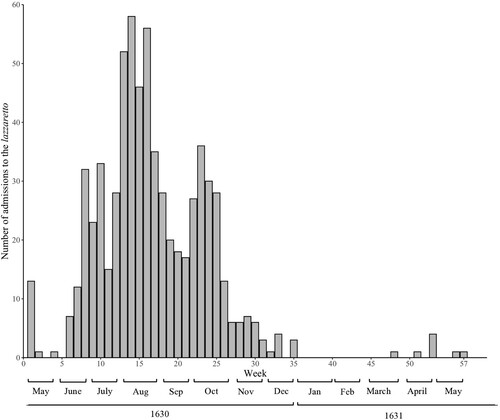
Table 1 Descriptive statistics by neighbourhood, Carmagnola, 1630–31
Figure 2 Observed and predicted proportions of households admitted by (a) fiscal group and geographic area; and (b) fiscal group only: Carmagnola 1630–31
Note: Calibrated value p = 0.075.
Source: As for .
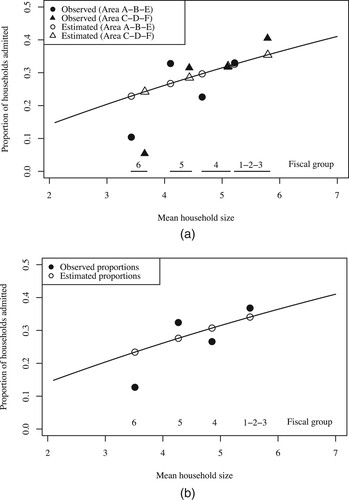
Table 2 Summary of model results comparing the predicted and the observed proportions of households admitted to the lazzaretto within each combination of geographic area and fiscal group, and marginally for the four fiscal groups: Carmagnola, 1630–31
Table 3 Comparison of predicted and observed average household sizes of admitted households, by fiscal group and geographic area: Carmagnola, 1630–31
Table 4 Average lag between first and last entry to the lazzaretto of household members, by geographic area and fiscal group: Carmagnola, 1630–31
Figure 3 Distribution of length of stay in the lazzaretto: Carmagnola 1630–31
Notes: This figure shows the distribution of length of stay of patients who: (a) died; and (b) survived and were discharged from the lazzaretto. The bin width is five days. For ease of visualization, we exclude the small fraction of cases who stayed in the lazzaretto for more than 100 days (2.4 per cent of patients); these are, however, included in all the subsequent analyses.
Source: As for .
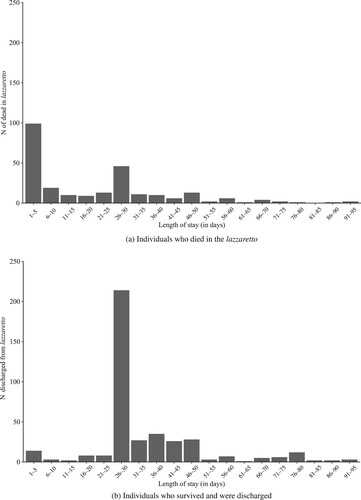
Table 5 Distribution of types (condition on entry and outcome) in the data set, by age, sex, and fiscal status: Carmagnola, 1630–31
Table 6 Logistic analysis of the probability of surviving the lazzaretto: Carmagnola, 1630–31
Table 7 Logistic analysis of the probability of surviving the lazzaretto among infected patients only: Carmagnola, 1630–31