
Figures & data
Figure 1 Mean loss by age (females and males) for five-year abridged schedules derived from the test set, , using six different methods
Note: Mean loss is calculated using Equationequation (17)(17)
(17) . Source: Based on HMD (Citation2016) data.
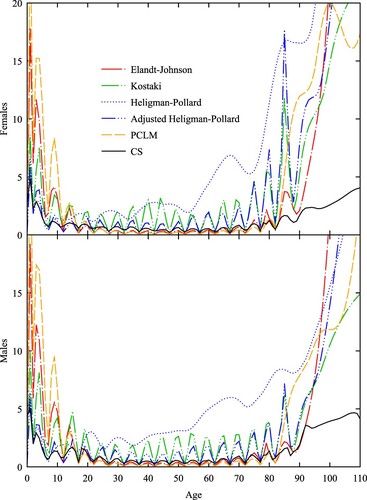
Figure 2 Death rates for Italian males in 1919: six expansion methods, five-year abridgement
Note: The death rate scale is logarithmic. Source: As for .
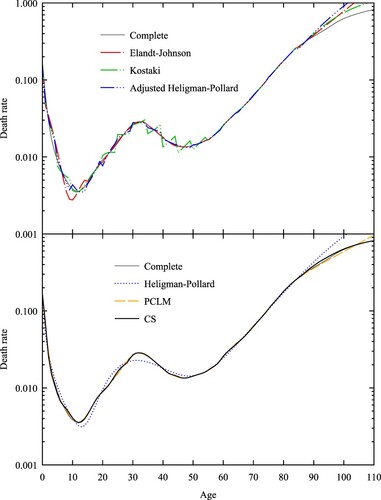
Figure 3 Mean loss by age (females and males) for 10-year abridged schedules derived from the test set, , using six different methods
Note: Mean loss is calculated using Equationequation (17)(17)
(17) . Source: As for .
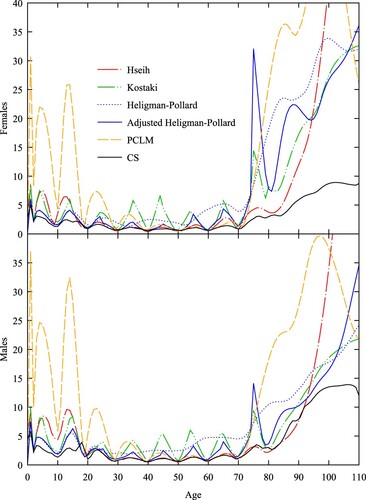
Figure 4 Death rates for Italian males in 1919: six expansion methods, 10-year abridgement
Note: The death rate scale is logarithmic. Source: As for .

Figure 5 Death rates for females and males, Iceland, 1868: five expansion methods and abridged CS rates compared with observed abridged rates
Notes: Grey area refers to 95 per cent confidence interval for abridged rates (which are shown by horizontal lines). Coale–Demeny West model life tables with for females and
for males were used as standards for the Brass relational method. The death rate scale is logarithmic. Source: As for .
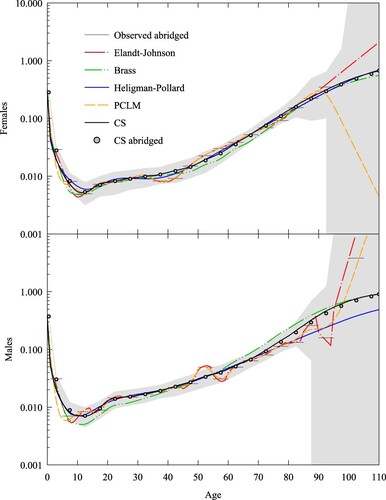
Figure 6 Death rates for females and males, Iceland, 2001: five expansion methods and abridged CS rates compared with observed abridged rates
Notes: Grey area refers to 95 per cent confidence interval for abridged rates (which are shown by horizontal lines). Coale–Demeny North model life tables with , for females and
for males were used as standards for the Brass relational method. The death rate scale is logarithmic. Source: As for .
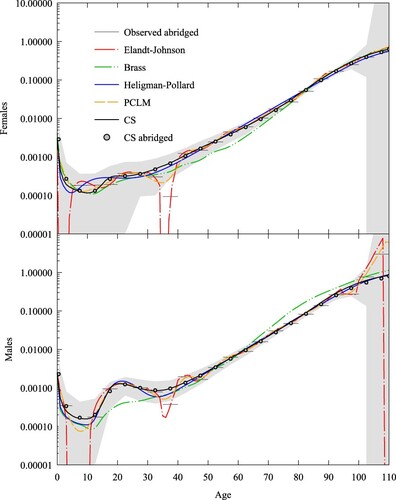
Table 1 Summary statistics for four expansion methods applied to five-year abridged death rates for females and males in Iceland, 1868 and 2001
Figure 7 Death rates for females and males, Burkina Faso 1996–2006: five expansion methods compared with observed abridged rates
Notes: Kostaki uses United Nations General model life table ( for females,
for males) as standard. Grey area refers to age range without reliable death rates. Abridged rates are shown by horizontal lines. The death rate scale is logarithmic. Source: Based on data from IGME (Citation2021) and Ouedraogo (Citation2020).
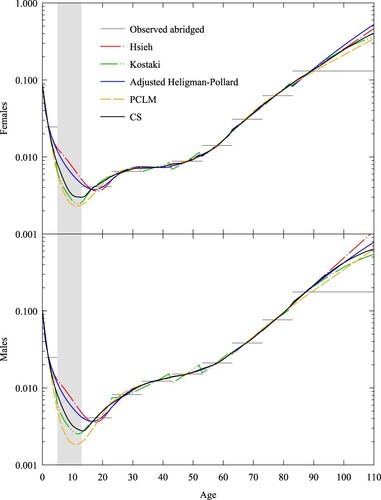
Figure 8 Death rates for females and males, Norway 1859: five expansion methods compared with censored abridged rates and complete rates
Note: Grey area refers to age range where death rates have been censored. Abridged rates are shown by horizontal lines. The death rate scale is logarithmic. Source: As for .
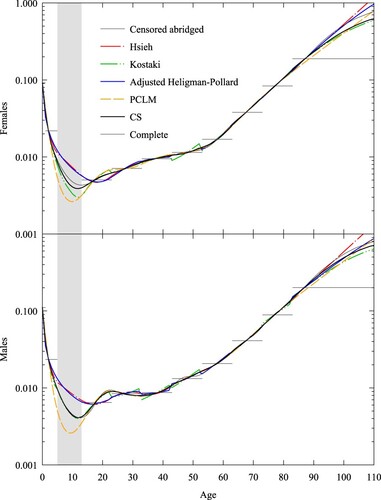
Figure 9 Death rates for female and male overseas-born Australian residents, 2019: five expansion methods, abridged CS rates, and CS fitted to Australian-born residents, compared with observed abridged rates
Notes: CS-AUS refers to CS fit to data for Australian-born residents. Grey area refers to 95 per cent confidence interval for abridged rates (which are shown by horizontal lines). Brass uses the CS fit to Australian-born death rates as standard. The death rate scale is logarithmic. Source: Based on data from ABS (Citation2019a, Citation2019b).
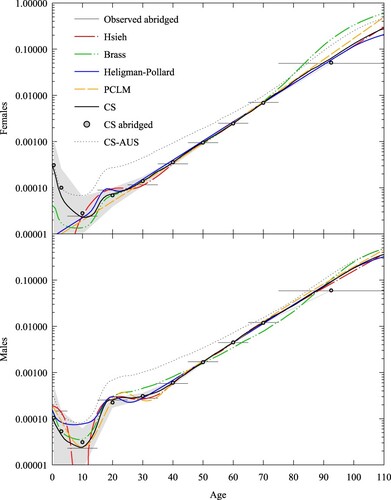
Table 2 Summary statistics for four expansion methods applied to 10-year abridged death rates for female and male overseas-born Australian residents in 2019