Figures & data
Figure 1 Weekly rations in kcal/day in the western Netherlands for different age groups and professions, October 1944 to July 1945
Source: National Archives of the Netherlands, Collection 2.11.23.02, inv.no. 192. See also: De Zwarte (Citation2020).
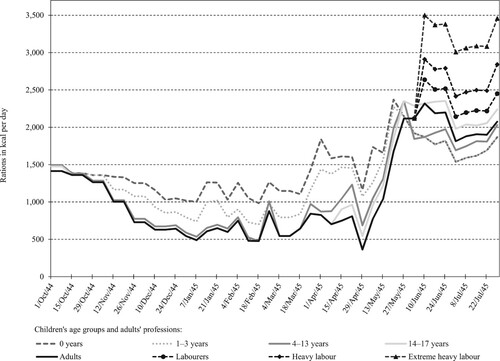
Figure 2 Annual mortality per 10,000 population at risk for selected age groups 0–14 and stillbirths, Netherlands, 1935–47
Source: CBS (Citation1957).
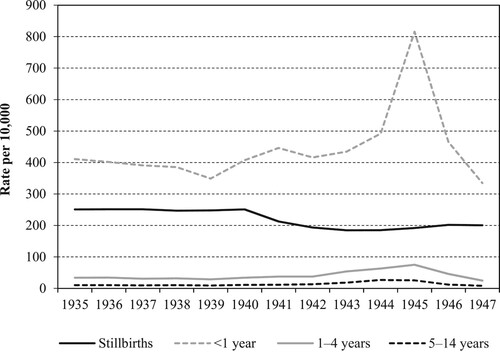
Figure 3 Monthly mortality per 10,000 population at risk for selected age groups 0–14 and stillbirths, three cities vs rest of the Netherlands, 1935–47
Source: Data compiled from CBS (Citation1935–Citation48), Bureau van Statistiek der Gemeente Amsterdam (Citation1945, Citation1949), Bureau voor Statistiek en Voorlichting der Gemeente ‘s–Gravenhage (Citation1946), Gemeentelijk Bureau voor de Statistiek Rotterdam (Citation1946), Ekamper et al. (Citation2020), and De Zwarte (Citation2020).
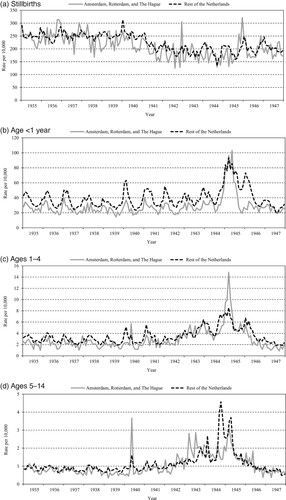
Table 1 Number of deaths, population at risk, and mortality per 10,000 population at risk at selected ages 0–14 years and stillbirths, in three cities vs rest of the Netherlands, for four time periods, Netherlands, 1935–47
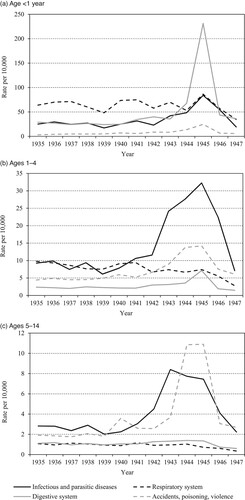
Figure 4 Annual mortality per 10,000 population at risk for selected age groups 0–14, by selected causes of death, Netherlands, 1935
Source: As for .