
Figures & data
Figure 1 Visual summary of data sources and data availability over time for the five parishes and Landskrona, southern Sweden
Source: Authors’ own.
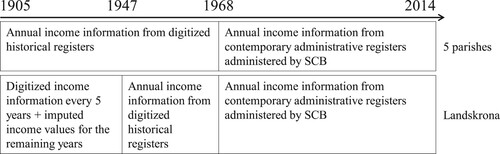
Table 1 Descriptive statistics: men and women aged 30–89 in selected areas of southern Sweden, by time period
Table 2 Hazard ratios of all-cause, non-preventable, and preventable mortality by family income: men and women aged 30–89 in selected areas of southern Sweden, by time period
Table 3 Hazard ratios of cause-specific mortality by family income: men and women aged 30–89 in selected areas of southern Sweden, by time period
Table 4 Hazard ratios of all-cause, non-preventable, and preventable mortality by family income and social class: men and women aged 30–89 in selected areas of southern Sweden, by time period