
Figures & data
Figure 1 Association between the Human Development Index and the fertility gap, by world region, 1976–2005
Notes: The HDI is a summary measure of average achievement in three dimensions of human development: length of life, educational attainment, and material living standards. It is calculated as the geometric mean of normalized indices for each of the three dimensions. The fertility gap is measured by subtracting total fertility from the average desired number of children. Observations correspond to different countries and to different points in time for the same country. A fertility gap above zero indicates excess fertility; a fertility gap below zero indicates a fertility deficit. The solid line represent the LOESS regression estimate.
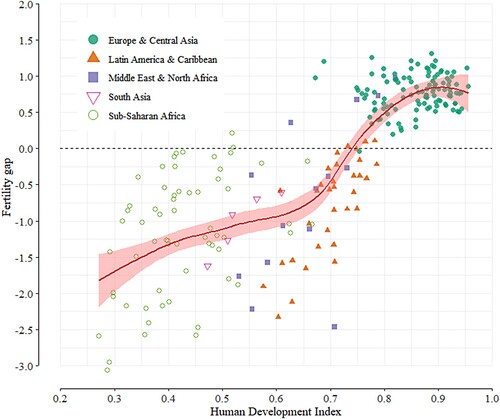
Figure 2 Hazard ratios of transitioning to a second child by cohort and educational level, as reported in Kravdal and Rindfuss (Citation2008): women, Norway
Note: The lowest educational level (primary) is the reference category.
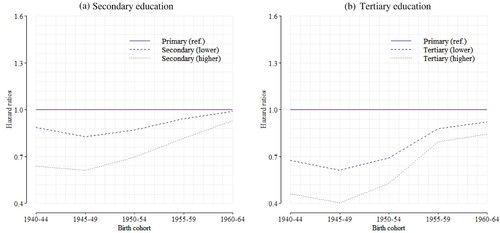
Figure 3 Observed and forecasted proportions of women by (a) education level and (b) labour force participation by education: cohorts, Norway
Notes: As the data clearly show, the proportion of women who have attained tertiary education and the proportion of women participating in the labour market have increased significantly over time. Although our simulation model classifies the simulated women as inactive/active in the labour market, here, for the sake of clarity, only the proportion of women actively participating in the labour market is displayed in panel (b). See the Data subsection for more information on these data and indicators.
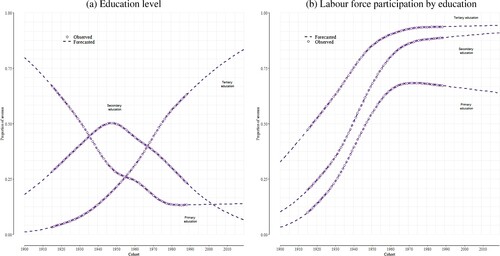
Figure 4 Observed vs simulated age-specific fertility rates: Norway, selected years
Notes: Observed age-specific fertility rates are plotted as solid diamonds. Dashed lines represent two separate simulations with the set of parameter values that best fit the observed data. The transparent diamonds represent the mean of these two simulations. The shaded area shows 95 per cent prediction intervals (range of values that contains the central 95 per cent of the posterior predictive distribution).
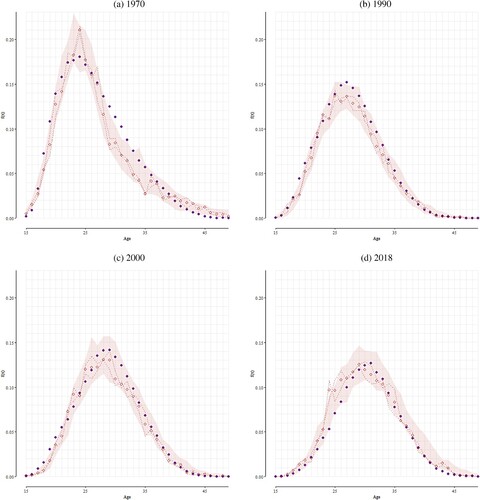
Figure 5 Model fit and 95 per cent prediction intervals: selected fertility indicators, Norway
Notes: Observed age-specific fertility rates are plotted as solid diamonds. Dashed lines represent two separate simulations with the set of parameter values that best fit the observed data. The transparent diamonds represent the mean of these two simulations. The shaded area shows 95 per cent prediction intervals (range of values that contains the central 95 per cent of the posterior predictive distribution).
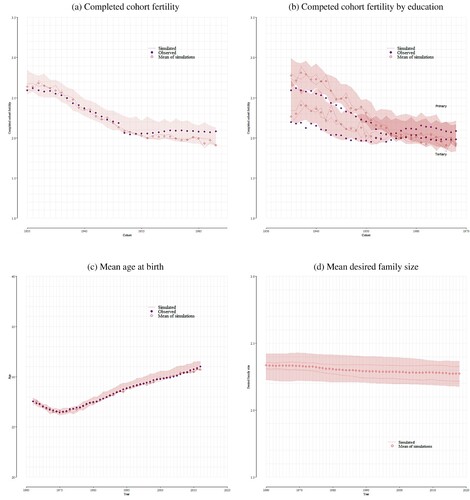
Figure 6 Hazard ratios for the transitions to second and third births by cohort and educational level for women in Norway: simulated vs observed results
Notes: The lowest education level (primary) is the reference category. Given that the focus of the analysis is the changes over time, the simulation model does not distinguish between different levels of secondary or tertiary education. Simulated results are reported with 95 per cent confidence intervals (shaded areas). The uncertainty of the estimates computed on the observed data is not reported in Kravdal and Rindfuss (Citation2008). See Data subsection for additional details on the educational attainment data. More information on the hazard regression models, including the coefficients presented here, can be found in the supplementary material.
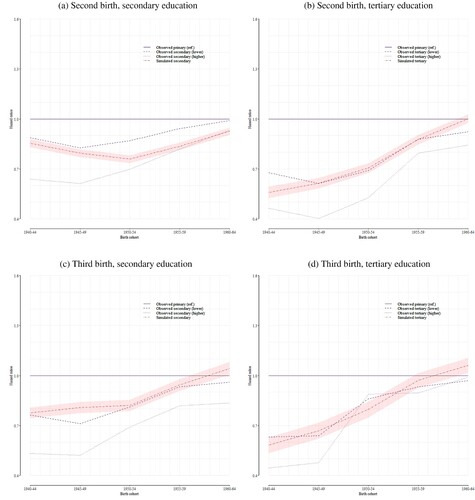
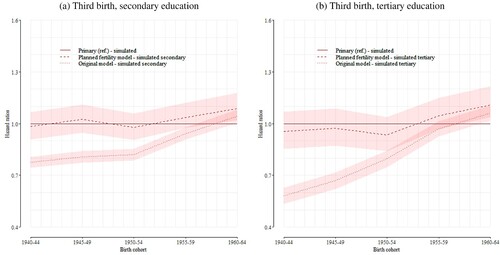
Figure 7 Hazard ratios for the transition to third birth by cohort and educational level for women in Norway: comparison of model specifications
Note: The lowest education level (primary) is the reference category. Simulated results are reported with 95 per cent confidence intervals (shaded areas).
Table
Table A1 Model parameters and best-fitting values: Norway