Figures & data
Figure 1 State space of the Markov model
Source: Authors’ own.
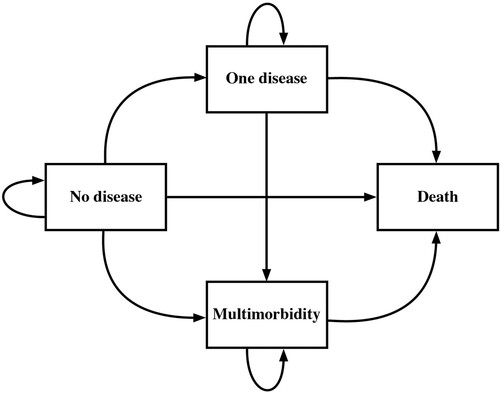
Table 1 Baseline socio-demographic characteristics and distribution of transitions between states of the analytic sample, by sex and overall: South Africa, 2008–17
Figure 2 Baseline prevalence (in percentages) of each disease included in our definition of multimorbidity: males and females, South Africa, 2008–17
Source: Authors’ analysis of data from South African National Income Dynamics Study (2008–17).
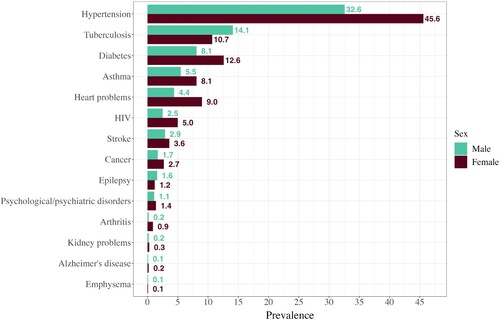
Figure 3 Probabilities of remaining in the same state or transitioning to a subsequent state by age: males and females, South Africa, 2008–17
Source: As for .
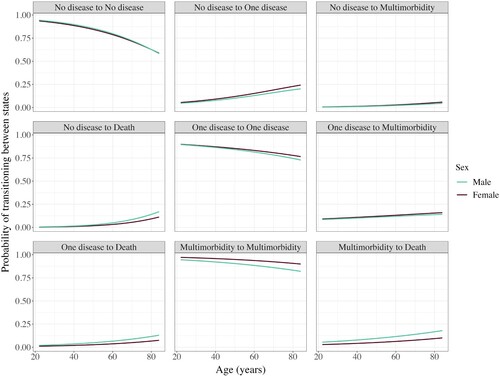
Table 2 Weighted life expectancy at age 20, multimorbid life expectancy, and percentage of life expectancy spent with multimorbidity: South Africa, 2008–17
Figure 4 Weighted life expectancy from age 20 split by time spent in each state, overall and for each race and education group: males and females, South Africa, 2008–17
Note: Estimates are obtained from Models 1, 2, and 3, Table 2. Shaded bars show percentages of remaining life expectancy in each state; total weighted life expectancy in years is shown at the end of each bar.
Source: As for .
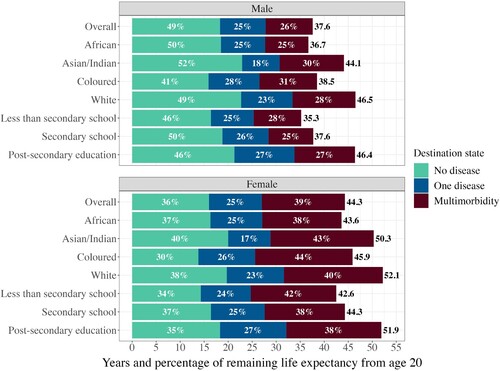
Figure 5 Weighted life expectancy from age 20 split by time spent in each state, overall and for each interacted race and dichotomized education group: males and females, South Africa, 2008–17
Notes: Estimates are obtained from Model 4, . Less than SS = less than secondary school; SS or more = secondary school or post-secondary education. Shaded bars show percentages of remaining life expectancy in each state; total weighted life expectancy in years is shown at the end of each bar.
Source: As for .
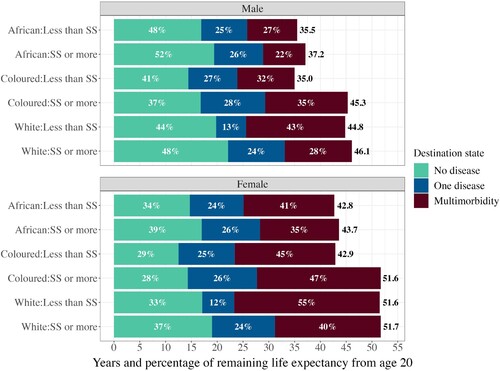
Figure A1 Males: probabilities of remaining in the same origin disease state or transitioning to a subsequent disease state or death over time, by race
Source: Authors’ analysis of data from South African National Income Dynamics Study (2008–17).
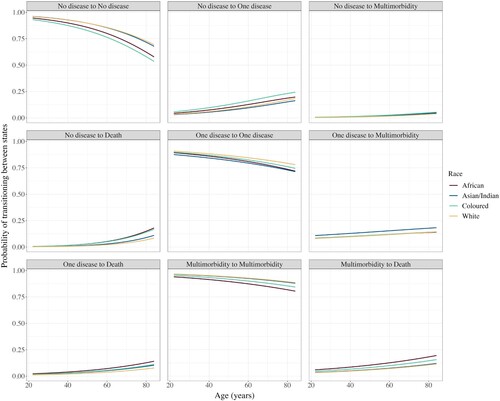
Figure A2 Females: probabilities of remaining in the same origin disease state or transitioning to a subsequent disease state or death over time, by race
Source: As for Figure A1.
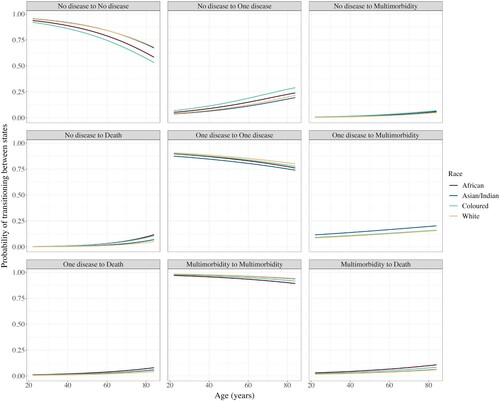
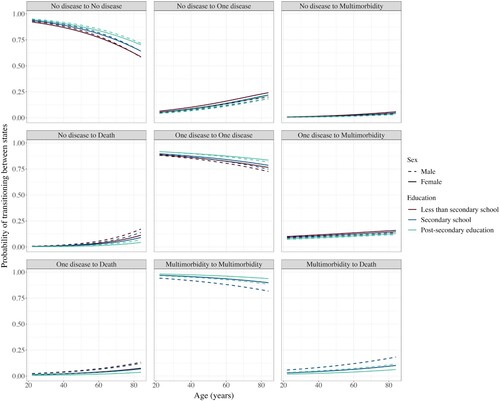
Figure A3 Probabilities of remaining in the same origin disease state or transitioning to a subsequent disease state or death over time, by sex and education
Note: For the transitions from multimorbidity to multimorbidity and from multimorbidity to death, the lines for ‘Less than secondary school’ overlap almost exactly with those for ‘Secondary school’.
Source: As for Figure A1.