
Figures & data
Figure 1. Disposition of patients.
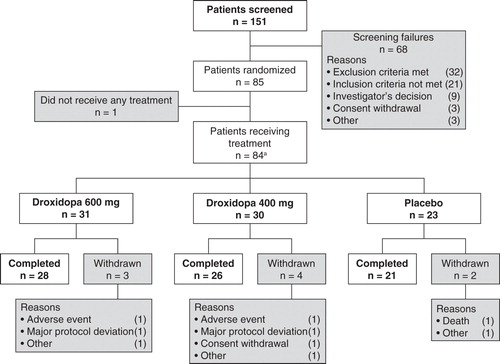
Table 1. Patient baseline/screening demographics, vital signs and medical history for the ITT population.
Table 2. Patient baseline BP: pre-, intra- and post-HD.
Table 3. Primary endpoint: changes in intra-HD MAP (mm Hg) over the study period.
Figure 2. Mean changes in intra-HD MAP, nadir intra-HD SBP and nadir intra-HD DBP across visits by treatment. Abbreviations: DBP = Diastolic blood pressure; HD = Hemodialysis; MAP = Mean arterial pressure; SBP = Systolic blood pressure.
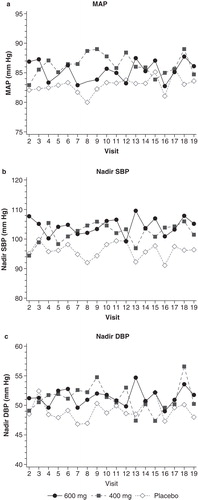
Table 4. Changes in average pre- versus post-HD arterial BP over the study period.
Table 5. Numbers of hypotension-induced interventions over the study period.
Table 6. Summary of adverse events (AEs; Safety population, n = 84).
Table 7. Most common adverse events (AEs) reported by ≥15% of patients in treatment group (safety population).