
Figures & data
Table 1. Study designs.
Table 2. Subject demographics.
Figure 1. Flow diagram of subject disposition: Panel (A) Study 1, Panel (B) Study 2, and Panel (C) Study 3. Note that five subjects were excluded from the pharmacokinetic (PK) analysis in Study 1 because predose diclofenac concentrations were >5% of maximum observed plasma concentration; thus, 25 subjects were included in the PK analysis.
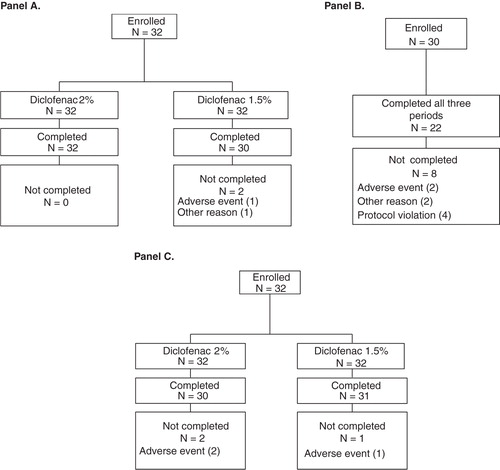
Table 3. Summary of diclofenac pharmacokinetic parameters on Day 1 and Day 8 of dosing with topical diclofenac 2% solution (40 mg/knee) BID and topical diclofenac 1.5% solution (19.3 mg/knee) QID in Study 1. Only data from study completers are shown.
Table 4. Summary of diclofenac pharmacokinetic parameters on Day 1 and Day 8 of dosing with topical diclofenac 2% solution (40.4 mg/knee) BID and topical diclofenac 1.5% solution (19.3 mg/knee) QID in Studies 2 and 3. Only data from study completers are shown.
Figure 2. Mean concentration of diclofenac in plasma on Day 1 (A) and Day 8 (B) after topical application of diclofenac sodium 2% and 1.5% solutions. Pooled analysis of data from subjects who completed treatment in two trials.
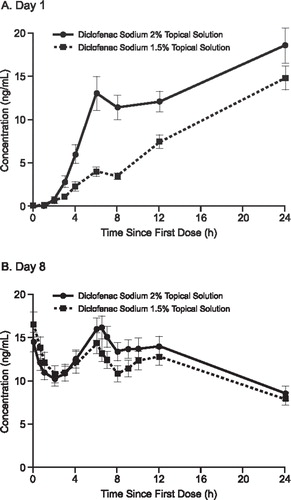
Table 5. Summary of diclofenac pharmacokinetic parameters on Day 1 and Day 8 of dosing with topical diclofenac 2% solution (40.4 mg/knee) BID and topical diclofenac 1.5% solution (19.3 mg/knee) QID. Combined results of data from Studies 2 and 3. Only data from study completers are shown.
Figure 3. Mean plasma concentration profile of diclofenac after topical application of diclofenac sodium 2% and 1.5% solutions and oral diclofenac 75 mg in Study 2 from 0 to 24 hours (Day 1, A), 24 to 168 hours (Days 2 to 7, B) and 168 to 192 hours (Day 8, C).
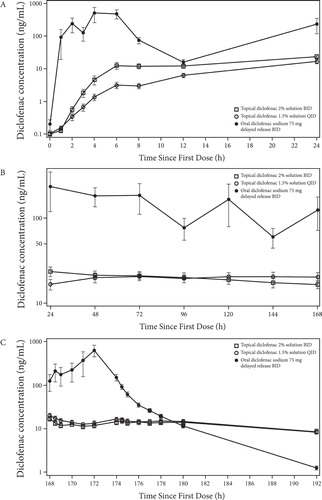
Table 6. Safety and tolerability of topical diclofenac 2% solution applied BID and topical diclofenac 1.5% solution applied QID for 7.5 days in three studies