Figures & data
Figure 1. Dynamic relationship among alirocumab, PCSK9, and LDL-C levels (data from single dose study; NCT01074372) is shown [Citation5]. A. Free PCSK9 and total alirocumab concentration versus time is shown. B. Free PCSK9 and total alirocumab concentration and mean percentage change in LDL-C versus time is shown. The single-dose study (NCT01074372) was conducted in healthy volunteers with no background statin or other lipid-lowering therapy.
![Figure 1. Dynamic relationship among alirocumab, PCSK9, and LDL-C levels (data from single dose study; NCT01074372) is shown [Citation5]. A. Free PCSK9 and total alirocumab concentration versus time is shown. B. Free PCSK9 and total alirocumab concentration and mean percentage change in LDL-C versus time is shown. The single-dose study (NCT01074372) was conducted in healthy volunteers with no background statin or other lipid-lowering therapy.](/cms/asset/b865cf48-b6aa-48c5-a3d9-26086dc7b976/ipgm_a_998987_f0001_b.jpg)
Table 1. Summary of alirocumab dosing schedule highlighting doses represented in all three Phase II studies [Citation6-8].
Figure 2. Patient disposition for the pooled analysis is shown.
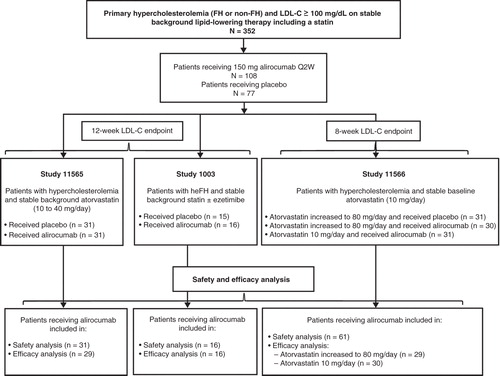
Table 2. Pooled baseline characteristics.
Table 3. Pooled TEAEs and safety and laboratory parameters.
Figure 3. Mean percentage change from baseline in LDL-C at week 8/12, last observation-carried-forward is shown in patients treated with alirocumab 150 mg Q2W. Efficacy data pooled from studies 11565 and 1003: 12-week end points, background therapy of either atorvastatin 10–40 mg (11565), or a statin ± ezetimibe (1003) and study 11566: 8-week end point, patients were on atorvastatin 10 mg/day at baseline; placebo arm and one treatment arm included up-titration of atorvastatin from 10 mg to 80 mg. Least squares (LS) means and P-values come from covariance analysis with treatment group and study as fixed effects and baseline as covariate. P-value is provided for descriptive purposes only.
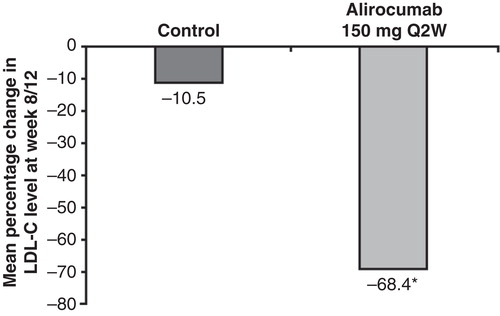
Figure 4. Attainment of prespecified LDL-C goals at week 8/12, last observation-carried-forward is shown.
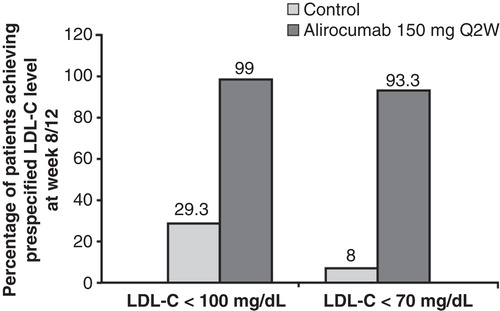
Figure 5. Mean percentage change from baseline in Apo B, non-HDL-C, Lp(a), triglycerides, and HDL-C at week 8/12, last observation-carried-forward is shown. P-values are derived from analyses of covariance with treatment group and study as fixed effects, and baseline as covariate, and are provided for descriptive purposes only. Not adjusted for multiplicity.
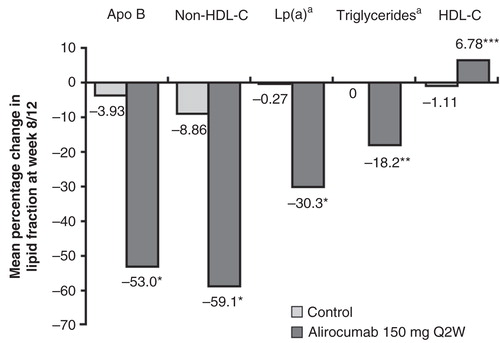
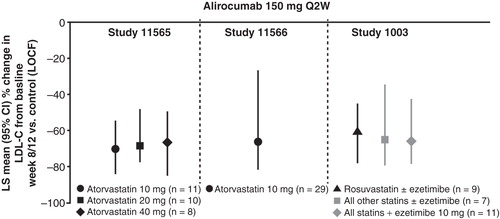
Figure 6. Mean percentage change from baseline in LDL-C with alirocumab 150 mg Q2W versus control at week 8/12 by stable background lipid-lowering therapy (LOCF) is shown.