
Figures & data
Figure 1. Diagram showing the path from hyperuricemia to structural joint damage. Long-standing hyperuricemia may lead to monosodium urate (MSU) deposits. Hyperuricemia is typically asymptomatic and is often associated with subclinical inflammation and bone erosion. Crystal shedding into the joint can cause Intermittent, acute inflammation and a gout flare-up. Continued crystal deposition can result in chronic manifestation of the disease, including persistent inflammation, increased number of flares, development of tophi, and structural joint damage. Adapted from Adv Ther, ‘A review of uric acid, crystal deposition disease, and gout’, volume 32, 2015, Perez-Ruiz F, et al, Figure 1: ‘Diagram showing the path from hyperuricemia to structural joint damage’ on page 32, with permission of Springer (© 2014) [Citation26].
![Figure 1. Diagram showing the path from hyperuricemia to structural joint damage. Long-standing hyperuricemia may lead to monosodium urate (MSU) deposits. Hyperuricemia is typically asymptomatic and is often associated with subclinical inflammation and bone erosion. Crystal shedding into the joint can cause Intermittent, acute inflammation and a gout flare-up. Continued crystal deposition can result in chronic manifestation of the disease, including persistent inflammation, increased number of flares, development of tophi, and structural joint damage. Adapted from Adv Ther, ‘A review of uric acid, crystal deposition disease, and gout’, volume 32, 2015, Perez-Ruiz F, et al, Figure 1: ‘Diagram showing the path from hyperuricemia to structural joint damage’ on page 32, with permission of Springer (© 2014) [Citation26].](/cms/asset/dc0baeec-d4e0-48b9-8ff6-447adf87dc73/ipgm_a_1221732_f0001_c.jpg)
Figure 2. Five-year cumulative incidence of gout according to sUA level in men in the Normative Aging Study [Citation33]. Reproduced with permission from Roddy E and Doherty M: Arthritis Res Ther 2010;12(6):223. [Citation32].
![Figure 2. Five-year cumulative incidence of gout according to sUA level in men in the Normative Aging Study [Citation33]. Reproduced with permission from Roddy E and Doherty M: Arthritis Res Ther 2010;12(6):223. [Citation32].](/cms/asset/340e4741-73c1-426a-81f0-005786cb20ed/ipgm_a_1221732_f0002_c.jpg)
Table 1. The ACR/EULAR gout classification criteria (reproduced with permission from Neogi et al. [Citation36].
Figure 3. Dual-energy computed tomography (DECT) images of ankle and foot (a, b) showing MSU crystal deposition in green color (arrows) and corresponding CT images (c, d) showing erosions (arrowheads). Reproduced with permission from Chowalloor PV, et al: Ther Adv Musculoskelet Dis 2014;6(4):131-43. [Citation40].
![Figure 3. Dual-energy computed tomography (DECT) images of ankle and foot (a, b) showing MSU crystal deposition in green color (arrows) and corresponding CT images (c, d) showing erosions (arrowheads). Reproduced with permission from Chowalloor PV, et al: Ther Adv Musculoskelet Dis 2014;6(4):131-43. [Citation40].](/cms/asset/3b63afd7-e837-4d80-b96e-a03d7d120635/ipgm_a_1221732_f0003_c.jpg)
Figure 4. Solubility of a substance (a solute) is the amount of that substance that will dissolve in a given amount of solvent; or it is a measure of how well one substance dissolves into another. A solute can fully dissolve in a solution that has less than the maximum amount of solute that can be dissolved. A saturated solution contains as much solute as it possibly can dissolve. A supersaturated solution contains more solute than can be dissolved, increasing the potential for crystal formation.
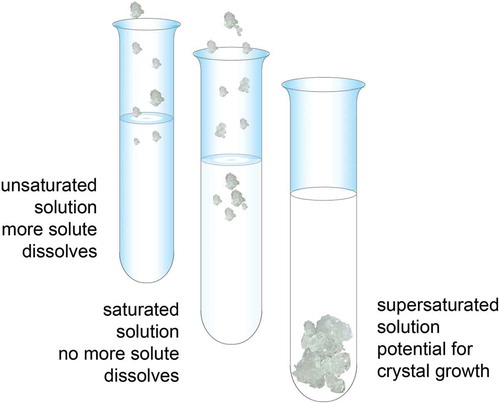
Figure 5. Mean serum urate levels versus velocity of tophi reduction. Reproduced with permission from Perez-Ruiz F, et al: Arthritis Rheum 2002;47(4):356-60. [Citation59].
![Figure 5. Mean serum urate levels versus velocity of tophi reduction. Reproduced with permission from Perez-Ruiz F, et al: Arthritis Rheum 2002;47(4):356-60. [Citation59].](/cms/asset/00a0fa4c-c208-435e-8932-aed7fe4048a4/ipgm_a_1221732_f0005_c.jpg)
Figure 6. Baseline ACR recommendations and overall strategy for treating and managing patients with gout. Data from Khanna D, et al: Arthritis Care Res (Hoboken) 2012;64(10):1431-46. [Citation53].
![Figure 6. Baseline ACR recommendations and overall strategy for treating and managing patients with gout. Data from Khanna D, et al: Arthritis Care Res (Hoboken) 2012;64(10):1431-46. [Citation53].](/cms/asset/104ceb70-c367-48fe-b4bd-8c57baa4f3fe/ipgm_a_1221732_f0006_c.jpg)
Table 2. Why keep serum uric acid levels <6 mg/dL?
Figure 7. Percentage of patients who required treatment for flares while receiving a maintenance dose of febuxostat to keep sUA levels <6 mg/dL. Reproduced with permission from Schumacher HR, Jr., et al: Rheumatology (Oxford) 2009;48(2):188-94. [Citation64].
![Figure 7. Percentage of patients who required treatment for flares while receiving a maintenance dose of febuxostat to keep sUA levels <6 mg/dL. Reproduced with permission from Schumacher HR, Jr., et al: Rheumatology (Oxford) 2009;48(2):188-94. [Citation64].](/cms/asset/1f2e3d60-4e0c-4eaa-ba07-5936d038f240/ipgm_a_1221732_f0007_c.jpg)