
Figures & data
Figure 1. Key differences between Study BUP1011 and BUP1025.
Table 1. Time-matched, placebo-adjusted QTcI change from baseline (msec) for BTDS 10 and moxifloxacin on Day 6 – Study BUP1011.
Table 2. Time-matched, placebo-adjusted QTcI change from baseline (msec) for BTDS 40 and moxifloxacin on Day 13 – Study BUP1011.
Table 3. Average QTcI interval change from baseline – Study BUP1011.
Figure 2. Mean QTcI change from baseline versus time by treatment on Day 6 (FAP) -Study BUP1011.
Time points for ECGs were 0, 0.5, 1, 1.5, 2, 2.5, 3, 4, 7, 10, 13, 18, and 23.5 hours.
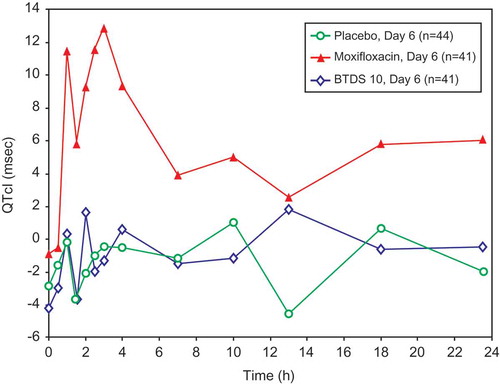
Figure 3. Mean QTcI change from baseline versus time by treatment on Day 13: FAP – Study BUP1011.
Time points for ECGs were 0, 0.5, 1, 1.5, 2, 2.5, 3, 4, 7, 10, 13, 18, and 23.5 hours.
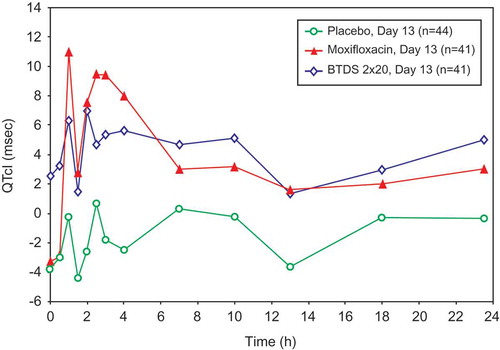
Table 4. Placebo-corrected change from baseline – estimates from the mixed-effect model for QTcI (msec) for BTDS only (FAP for ECG) – Study BUP1025.
Table 5. Placebo-corrected change from baseline – estimates from the mixed-effect model for QTcI (msec) for BTDS with naltrexone (FAP for ECG) – Study BUP1025.
Table 6. Placebo-corrected change from baseline – estimates from the mixed-effect model for QTcI (msec) for naltrexone alone (FAP for ECG) – Study BUP1025.
Table 7. Placebo-corrected change from baseline – estimates from the mixed-effect model for QTcI (msec) for moxifloxacin (FAP for ECG) – Study BUP1025.
Figure 4. Placebo-corrected change from baseline QTcI (msec) versus time on Day 6 – buprenorphine 10 mcg/h (FAP for ECG) – Study BUP1025.
Time points for ECGs were 0, 0.5, 1, 1.5, 2, 2.5, 3, 4, 7, 10, 13, 18, and 23.5 hours.
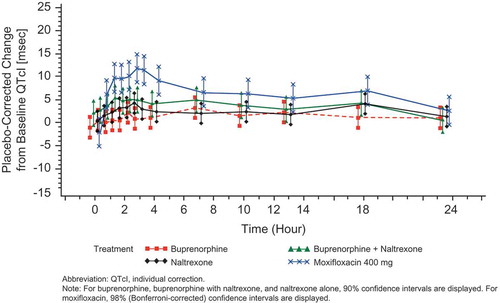
Figure 5. Placebo-corrected change from baseline QTcI (msec) versus time on Day 13 – buprenorphine 40 mcg/h (FAP for ECG) – Study BUP1025.
Time points for ECGs were 0, 0.5, 1, 1.5, 2, 2.5, 3, 4, 7, 10, 13, 18, and 23.5 hours.
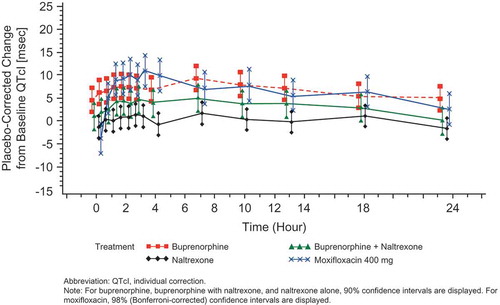
Figure 6. Placebo-corrected change from baseline QTcI (msec) versus time on Day 17 – buprenorphine 80 mcg/h (FAP for ECG) – Study BUP1025.
Time points for ECGs were 0, 0.5, 1, 1.5, 2, 2.5, 3, 4, 7, 10, 13, 18, and 23.5 hours.
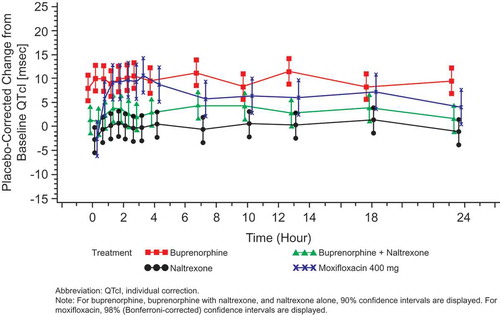
Figure 7. Scatter plot and regression line of mean QTcI change vs mean plasma concentration of buprenorphine (pg/mL) for BTDS treatment group – Study BUP1011.
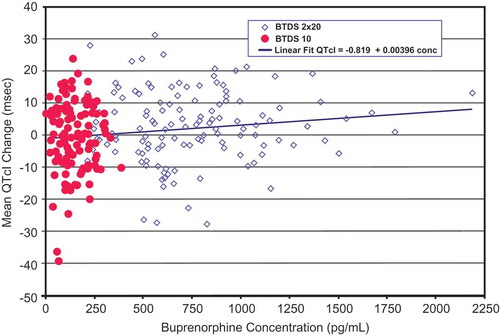
Figure 8. Placebo-corrected change from baseline QTcI versus mean buprenorphine plasma concentration – estimates from the mixed-effects model regression – BTDS only (PK/PD analyses) – Study BUP1025.
The colors are only to highlight the distributions of the doses; the PK/PD model does not include dose.
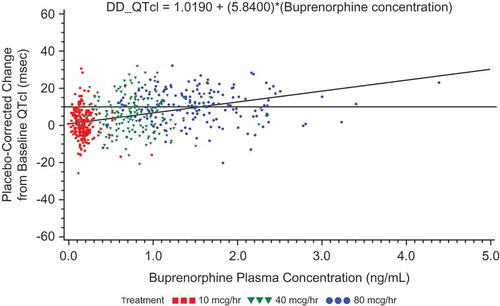
Figure 9. Placebo-corrected change from baseline QTcI versus mean buprenorphine plasma concentration – estimates from the mixed-effects model regression – BTDS with naltrexone (PK/PD analyses) – Study BUP1025.
The colors are only to highlight the distributions of the doses; the PK/PD model does not include dose.
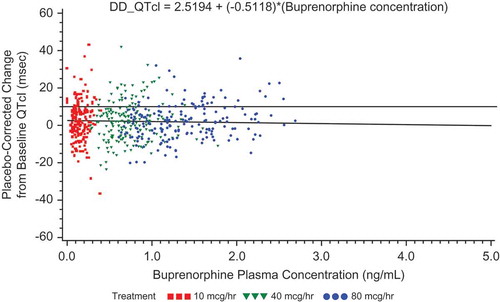
Table 8. Summary of mean plasma pharmacokinetic metrics of buprenorphine (FAP) – Study BUP1025.