
Figures & data
Figure 1. Schematic diagram of segmentation of 9 consecutive levels of the aorta.
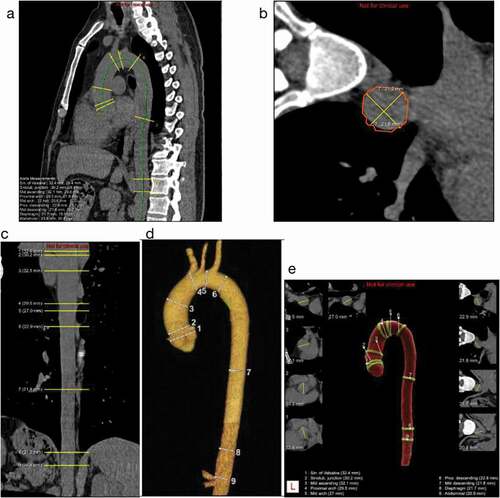
Figure 2. The distribution of ADs at nine positions among groups.
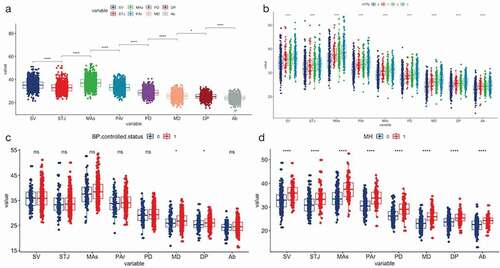
Table 1. The distribution of basic population materials in the graded diagnosis of HTN
Table 2. The distribution of basic materials between groups of BP well-controlled and BP poor-controlled in HTN and the distribution of basic materials between groups of MH and non-HTN in people with normal clinic BP
Figure 3. The Correlation matrix of age, BMI, SBP, DBP and ADs at 9 positions.
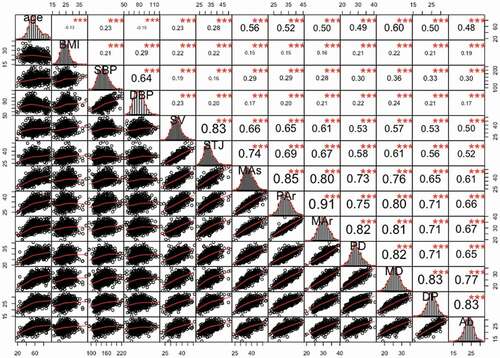
Figure 4. Scatter plot and fitting curve/plane between BP, age and ADs.
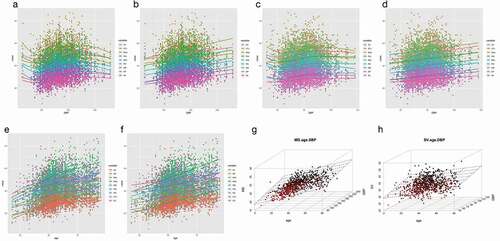
Table 3. Univariate linear regression analysis between BP (SBP, DBP) and AD, age and AD
Table 4. The OR value and 95% CI of the ADs in the population with different characteristics to the adverse BP states obtained by logistic regression analysis
Figure 5. The ROCs of ADs at nine positions to identify poor BP status.
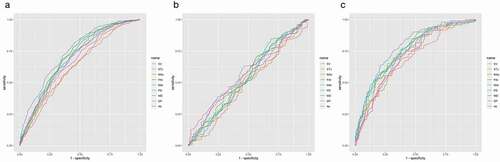
Table 5. The ROCs of ADs to identify poor BP states among people with different BP characteristics
Supplemental Material
Download PDF (395.6 KB)Data availability statement
Data is openly available in a public repository that issues datasets with DOIs