
Figures & data
Table 1. Categories used to describe albuminuria
Figure 1. Association of UACR and eGFR with cardiovascular mortality [Citation19]. Adjusted for each other (UACR or eGFR), age, gender, race, CVD history, systolic blood pressure, diabetes, smoking, and total cholesterol. Circles represent statistically significant, and triangles represent not significant.
![Figure 1. Association of UACR and eGFR with cardiovascular mortality [Citation19]. Adjusted for each other (UACR or eGFR), age, gender, race, CVD history, systolic blood pressure, diabetes, smoking, and total cholesterol. Circles represent statistically significant, and triangles represent not significant.](/cms/asset/624fcb0b-4048-4075-a6f4-effa4759f8e4/ipgm_a_2009726_f0001_c.jpg)
Figure 2. Guideline recommendations for the assessment of UACR and eGFR. a Calculated from serum creatinine (CKD-EPI); b With random spot urine sample; c Early morning urine sample is preferred.
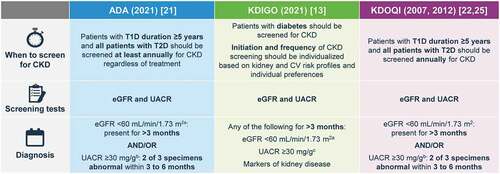
Figure 3. KDIGO guide to frequency of monitoring by GFR and albuminuria category [Citation12]. Grid reflects the risk of progression by intensity of coloring (green: low risk [if no other markers of kidney disease, no CKD]; yellow: moderately increased risk; Orange: high risk; red/deep red, very high risk). The numbers in the boxes are a guide to the frequency of monitoring (number of times per year).
![Figure 3. KDIGO guide to frequency of monitoring by GFR and albuminuria category [Citation12]. Grid reflects the risk of progression by intensity of coloring (green: low risk [if no other markers of kidney disease, no CKD]; yellow: moderately increased risk; Orange: high risk; red/deep red, very high risk). The numbers in the boxes are a guide to the frequency of monitoring (number of times per year).](/cms/asset/b6b2932e-d30f-4359-bdf5-804dad0c4d30/ipgm_a_2009726_f0003_c.jpg)
Table 2. Summary of risk mitigation strategies for SGLT2is, GLP-1 RAs, and MRAs in DKD
Figure 4. Optimal treatment recommendations for CKD associated with T2D. a Referring clinicians may wish to discuss with their nephrology service depending on local arrangements regarding monitoring or referring. KDIGO guidelines provide direction on when to consider referral to a nephrologist based on eGFR and UACR levels (); b For people with normal to mildly increased albuminuria (UACR <30 mg/g and eGFR >60 mL/min/1.73 m2), no immediate treatment to reduce CKD progression is required, but such individuals should be rescreened within a year, and guideline-directed therapy should be optimized to prevent micro and macrovascular complications. Refer to ADA guidelines to improve glycemic control and lipid levels, maintain healthy body weight, and optimize blood pressure; c ACEi or ARB therapy should be maintained even if eGFR is reduced.
Figure 5. KDIGO referral decision making by eGFR and albuminuria [Citation12]. *Referring clinicians may wish to discuss with their nephrology service depending on local arrangements regarding monitoring or referring.
![Figure 5. KDIGO referral decision making by eGFR and albuminuria [Citation12]. *Referring clinicians may wish to discuss with their nephrology service depending on local arrangements regarding monitoring or referring.](/cms/asset/1560a61f-a3c3-40a1-97de-0cd4fd0ddb6b/ipgm_a_2009726_f0005_c.jpg)
Table 3. Current KDIGO criteria of nephrology referral in CKD [Citation12]