
Figures & data
Table 1. Final DCE Attributes and Levels
Table 2. Treatment Profiles
Table 3. Error component logit model results (main effects, n = 118)
Table 4. Relative attribute importance (RAI) for differences in attribute levels based on ‘beating heart’ versus ‘open-heart surgery-like’ treatment profiles (n = 118)
Table 5. Maximum (or minimum) acceptable risk (MAR) thresholds for A) symptoms reappearing and B) reintervention
Figure 1. Probability of choosing a ‘beating heart’ treatment as each attribute shifts.
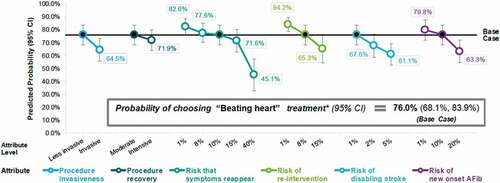
Table A1. Initial (version 1) DCE attributes and levels
Table A2. Full description of final attributes and levels
Table A3. Final DCE design
Table A4. Dominance test task
Table A5. Holdout task for comparison of choice probabilities
Table A6. Inclusion and exclusion criteria
Table A7. Participant sociodemographic characteristics (n = 118)
Table A8. Participant clinical characteristics (n = 118)
Table A9. Participant mitral regurgitation treatment history characteristics (n = 118)
Table A10. DCE data quality metrics for the full sample including all complete survey responses (n = 145)
Table A11. Participant evaluation of DCE (n = 118)
Table A12. Swait-Louviere scale test procedure results
Table A13. Conditional/multinomial logit model results (main effects, n = 118)
Table A14. Error component logit model results (main effects, n = 118) – categorical specification
Table A15. Conditional/multinomial logit model results (main effects, n = 118) – categorical specification