
Figures & data
Exploring the Wider Benefits of Semaglutide
Figure 1. Tools used to assess quality of life outcomes in the STEP trial program.
QOL, quality of life.
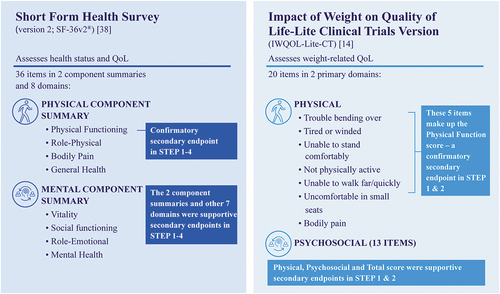
Figure 2. Effect of semaglutide versus placebo on IWQOL-Lite-CT Physical Function scores in STEP 1 and 2 [Citation31,Citation34].
Data presented as ETDs for semaglutide versus placebo and associated 95% CIs for patients in the full analysis set based on the treatment policy estimand (assessed treatment effect regardless of treatment discontinuation or rescue intervention). The range of possible scores for the total IWQOL-Lite-CT is 0–100. CI, confidence interval; ETD, estimated treatment difference; IWQOL-Lite-CT, Impact of Weight on Quality of Life-Lite Clinical Trials Version; OW, once weekly; T2D, type 2 diabetes.
![Figure 2. Effect of semaglutide versus placebo on IWQOL-Lite-CT Physical Function scores in STEP 1 and 2 [Citation31,Citation34].](/cms/asset/65ae78cd-7428-4c11-982b-d0e78de3f977/ipgm_a_2150006_f0002_c.jpg)
Figure 3. Effect of semaglutide versus placebo on SF-36v2 Physical Functioning scores in STEP 1–4 [Citation31–34].
aIn STEP 4, participants received once-weekly subcutaneous semaglutide 2.4 mg during a 20-week run-in phase then were randomized to 48 weeks of continued semaglutide or switched to placebo. Data presented as ETDs for semaglutide versus placebo and associated 95% CIs for patients in the full analysis set based on the treatment policy estimand (assessed treatment effect regardless of treatment discontinuation or rescue intervention). SF-36v2 scores are normative-based scores, which were transformed to a scale where the 2009 US general population has a mean of 50 and a standard deviation of 10; the range of possible scores using this normative-based approach is 19.03–57.60 for the Physical Functioning domain. CI, confidence interval; ETD, estimated treatment difference; IBT, intensive behavioral therapy; OW, once weekly; SF-36v2, 36-item Short Form Health Survey version 2; T2D, type 2 diabetes.
![Figure 3. Effect of semaglutide versus placebo on SF-36v2 Physical Functioning scores in STEP 1–4 [Citation31–34].](/cms/asset/26d481ad-4f6a-4b57-87d2-af91aa810b58/ipgm_a_2150006_f0003_c.jpg)
Figure 4. Effect of semaglutide and placebo on body composition from baseline to week 68 in STEP 1 [Citation34,Citation42].
Total fat mass and total lean body mass were measured using dual-energy x-ray absorptiometry at screening and at week 68. Proportions of total fat and lean body mass are shown relative to total body mass. Data are based on the treatment policy estimand (assessed treatment effect regardless of treatment discontinuation or rescue intervention). Supportive secondary endpoint analyses were not adjusted for multiplicity and P-values are therefore not reported for this endpoint. OW, once weekly.
![Figure 4. Effect of semaglutide and placebo on body composition from baseline to week 68 in STEP 1 [Citation34,Citation42].](/cms/asset/56bc4661-6e90-45bd-8e48-e93ea21d77c3/ipgm_a_2150006_f0004_c.jpg)