
Figures & data
Figure 1. Flowchart of exclusion steps to determine final GAP cohort.
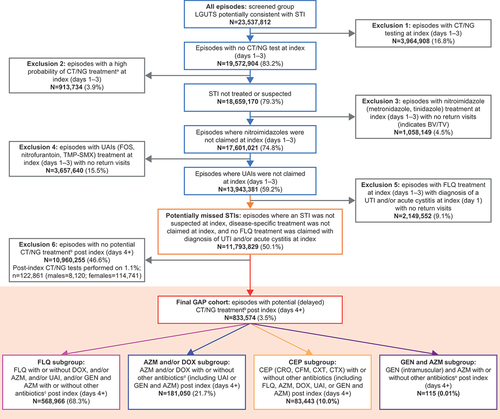
Table 1. Patient characteristics of the GAP cohort (episode-level).
Table 2. STI testing rates and number of return visits for the GAP cohort post index (days +4).
Table 3. Time to post-index STI treatment among patients within the GAP cohort who were diagnosed with a UTI and/or acute cystitis at index.
Table 4. Conditions diagnosed at index (day 1) within the GAP cohort.
Table 5. Conditions diagnosed post index (days 4+) within the GAP cohort.
Data availability statement
The patient data that support the findings of this study are available from the IBM (now Merative™) MarketScan Research Databases (Commercial Database and Multi-State Medicaid Database), but restrictions apply to the availability of these data, which were used under license for the current study and are not publicly available. The databases are available for secondary use on a commercial basis, and requests for access to the data should be sent to IBM Watson Health and not the corresponding author. All data generated from the analysis of the databases are included in this published article.