
Figures & data
Table 1. Muscle ultrasound findings of the anterior rectum before (v1) and after the nutritional intervention (v3). The figure shows the (a) longitudinal and (b) transversal basal section before nutritional intervention and after it (c and d, respectively).
Figure 1. (a) measurement of muscle ultrasound images upon arrival at the endocrinology and nutrition unit. Muscle thickness (Y-axis): 0.73 cm; muscle is in cm2: 2.11 cm2, (b) measurement of muscle ultrasound images at 3 months of intervention, during outpatient follow-up. Muscle thickness (Y-axis): 0.74 cm; muscle is in cm2: 2.11 cm2.
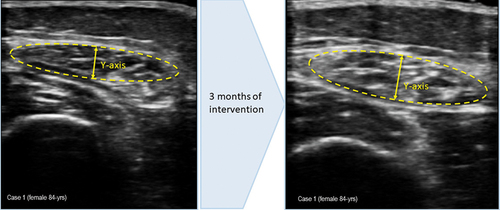
Figure 2. (a) measurement of muscle ultrasound images before intervention. Muscle thickness (Y-axis): 1.01 cm; muscle is in cm2: 2.72. (b) measurement of muscle ultrasound images at 3 month of intervention. Muscle thickness (Y-axis): 0.94 cm; muscle is in cm2: 2.78.
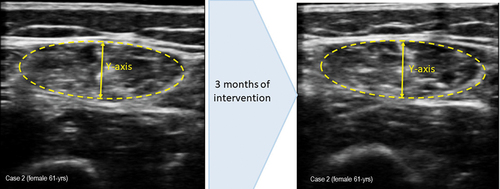
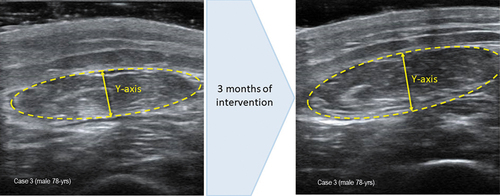
Figure 3. (a) measurement of muscle ultrasound images before intervention. Muscle thickness (Y-axis): 0.81 cm; muscle is in cm2: 2.47. (b) measurement of muscle ultrasound images at 3 month of intervention. Muscle thickness (Y-axis): 0.89 cm; muscle is in cm2: 2.85.
Data availability statement
All relevant data are included in the article. Further inquiries can be directed to the corresponding authors.