Figures & data
Figure 1. Cutting insert geometry.
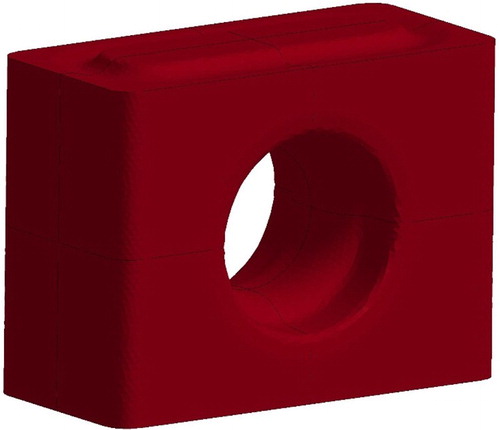
Figure 2. Finite element mesh before compaction. Because of symmetry only one-eighth of the insert is analysed.
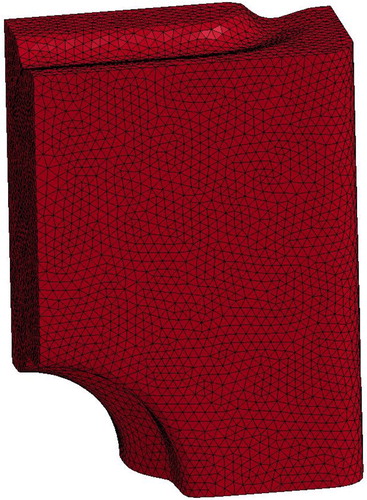
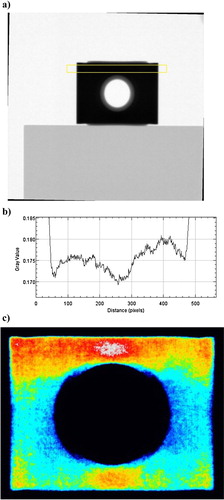
Figure 3. Analysis of the calibration rod with length 5 mm. (a) Negative logarithmic image of the relative intensity I/I0, i.e. αx. Note the box indicated in the picture. (b) The quantity αx (grey value) along the horizontal direction starting from the left side of the yellow box in (a).
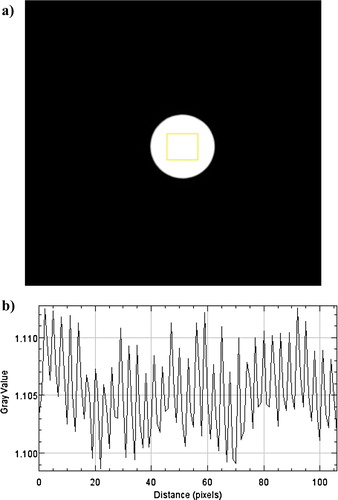
Figure 4. LAC (α) as function of calibration rod length.
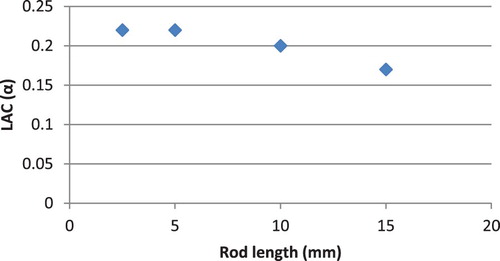
Figure 5. Analysis of a calibration rod standing up. (a) Relative intensity I/I0 radiograph with two boxes indicated. (b) Relative intensity I/I0 (grey value), in the vertical direction starting from the top in the left box in (a). (c) Relative intensity I/I0 (grey value), in the vertical direction starting from the top in the right box in (a).
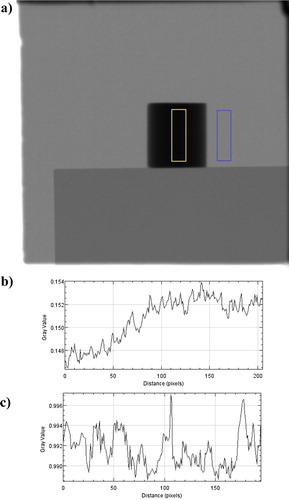
Figure 6. ‘Virtual radiograph’ showing αx, produced from 50 cuts in depth of FE-results for the density. he darker areas above and below the hole corresponds to a high value on the density and the darker areas left and right of the hole to an equivalently low value.
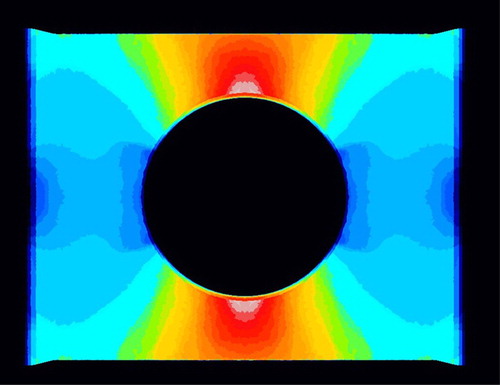
Figure 7. Analysis of a cross hole insert. (a) Relative intensity I/I0 radiograph with a box indicated. (b) Relative intensity I/I0 (grey value), in the horizontal direction starting from the left side of the box in (a). (c) Colour coded radiograph showing αx in the same manner as for . As in ,the darker areas above and below the hole corresponds to a high value on the density and the darker areas left and right of the hole to a low value.