
Figures & data
Figure 1. Alloying philosophy in conventional metallurgy and in HEAs.
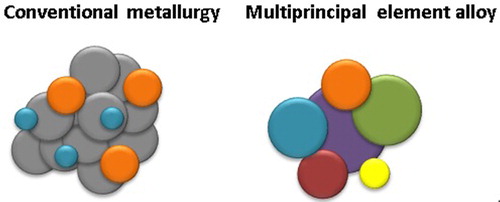
Figure 2. Papers published from 2008 on PM HEAs.
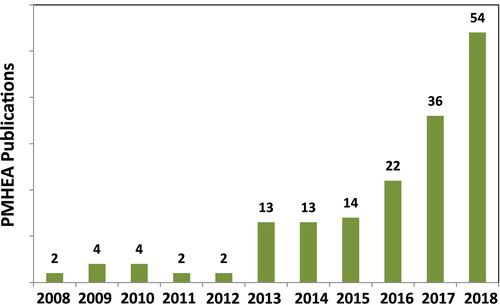
Figure 3. Classification of ingot metallurgy HEAs.
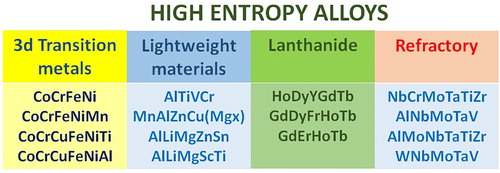
Figure 4. Distribution (frequency) of alloying elements in the studied PM HEAs (i.e. Fe is in 152 different alloys; Al in 98 of the studied alloys).
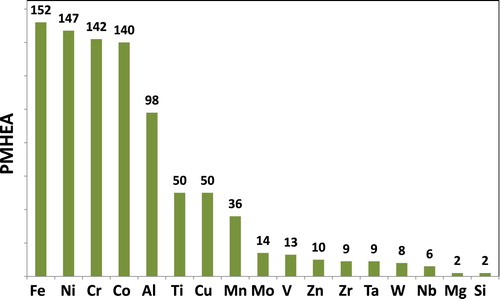
Figure 5. Main alloying elements in the HEAs studied.
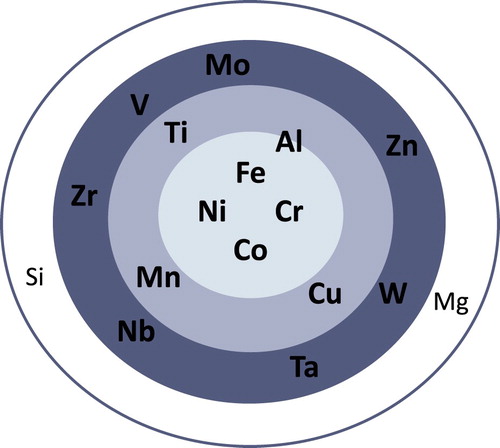
Figure 6. Dendrogram (‘tree diagram’) showing the 9 types of HEA alloys derived from the HCA.
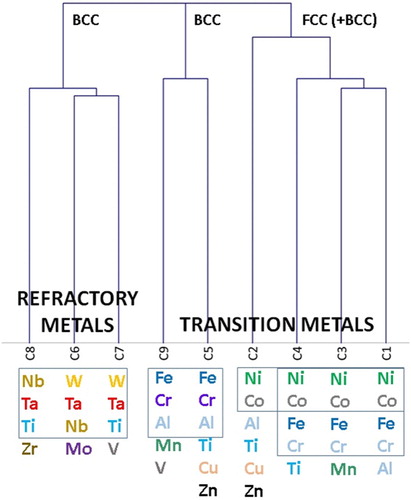
Table 1. Clusters compositions and some members in the cluster.
Figure 7. Superimposed effect of ΔHmix, δ (atomic size) and ΔSmix on phase stability in equiatomic multi-component alloys and bulk metallic glasses. The symbol ○ represents equiatomic amorphous phase forming alloys; ● represents non-equiatomic amorphous phase forming alloys; □ represents solid solution phases and △ represents intermetallic phases. The region delineated by the dash-dotted lines indicates the requirements for solid solution phases to form, from [Citation180].
![Figure 7. Superimposed effect of ΔHmix, δ (atomic size) and ΔSmix on phase stability in equiatomic multi-component alloys and bulk metallic glasses. The symbol ○ represents equiatomic amorphous phase forming alloys; ● represents non-equiatomic amorphous phase forming alloys; □ represents solid solution phases and △ represents intermetallic phases. The region delineated by the dash-dotted lines indicates the requirements for solid solution phases to form, from [Citation180].](/cms/asset/e96d5873-296b-4203-9c67-b09a933fb6d5/ypom_a_1584454_f0007_oc.jpg)
Figure 8. A δ (atomic size)-ΔHmix plot delineating the phase selection in high entropy alloys. The dash-dotted regions highlight the individual region to form solid solutions, intermetallic compounds and the amorphous phase. From [Citation182].
![Figure 8. A δ (atomic size)-ΔHmix plot delineating the phase selection in high entropy alloys. The dash-dotted regions highlight the individual region to form solid solutions, intermetallic compounds and the amorphous phase. From [Citation182].](/cms/asset/e9747fd4-7312-4397-9cac-bb4c02e67e36/ypom_a_1584454_f0008_oc.jpg)
Figure 9. Relationship between VEC and the FCC, BCC phase stability for various HEA systems.
Notes: Fully closed symbols for sole FCC phases; fully open symbols for sole BCC phase; top-half closed symbols for mixed FCC and BCC phases, from [Citation183].
![Figure 9. Relationship between VEC and the FCC, BCC phase stability for various HEA systems.Notes: Fully closed symbols for sole FCC phases; fully open symbols for sole BCC phase; top-half closed symbols for mixed FCC and BCC phases, from [Citation183].](/cms/asset/19abbb67-8f7d-4c85-a471-a7324c8ae58a/ypom_a_1584454_f0009_oc.jpg)
Figure 10. Mechanical alloying conditions. The length of the bars represent the number of times a certain procedure was used.
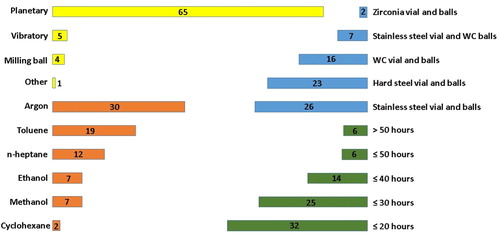
Figure 11. Frequency of the main phases associated to the clusters’ compositions, obtained after the mechanical alloying step: BCC, FCC and BCC with some minor FCC and FCC with some minor BCC.
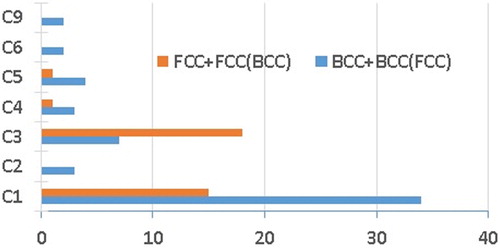
Figure 12. Different PM processing routes to obtain PMHEAs.
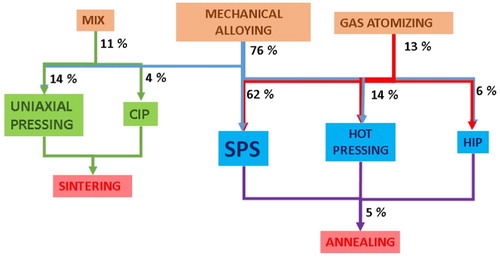
Table 2. Comparison of some tensile properties of HEAs made by ingot casting and PM and a TWIP steel.
Table 3. Tensile features of AM HEAs in the growth direction and at 90°, and compared with those of an equivalent cast HEA (from [Citation78]).
Figure 13. TEM microstructures and SAED pattern of a twinned FCC phase. (a) A twinned FCC grain with the corresponding SAED pattern and (b) a twinned FCC grain surrounded by Cr23C6 carbide, from [Citation34].
![Figure 13. TEM microstructures and SAED pattern of a twinned FCC phase. (a) A twinned FCC grain with the corresponding SAED pattern and (b) a twinned FCC grain surrounded by Cr23C6 carbide, from [Citation34].](/cms/asset/7eba510f-711b-4a14-9dc5-5ca6086477c1/ypom_a_1584454_f0013_oc.jpg)
Table 4. Comparison of tensile properties from room temperature to 650 °C, from [Citation119].
Figure 14. Stress-strain curve of Al0.4FeCrCo1.5NiTi0.3 reinforced by nano-Al2O3 after SPS under compression. From [Citation98].
![Figure 14. Stress-strain curve of Al0.4FeCrCo1.5NiTi0.3 reinforced by nano-Al2O3 after SPS under compression. From [Citation98].](/cms/asset/0e7dbae9-97fe-443b-86c9-78ac5c7d7362/ypom_a_1584454_f0014_ob.jpg)
Figure 15. Ultimate compressive strength vs. deformation at fracture of different HEA.
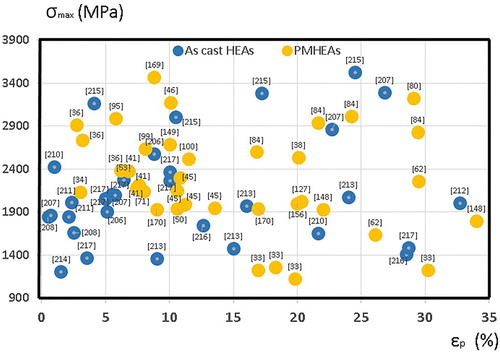
Figure 16. Ultimate compression strength vs. deformation at fracture considering the cluster composition.
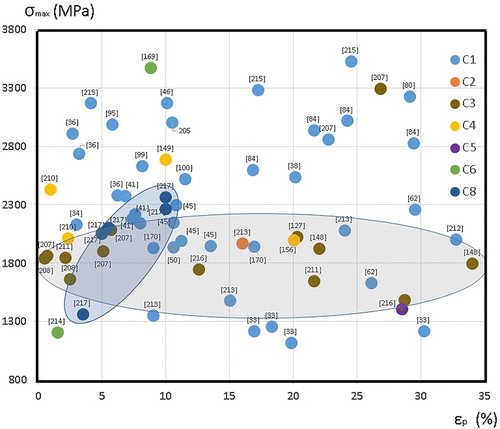
Figure 17. Hardness vs. deformation at fracture of different HEA.
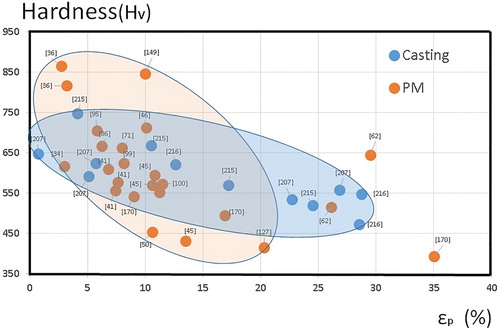
Figure 18. Tensile features for different HEAs and other structural alloys.
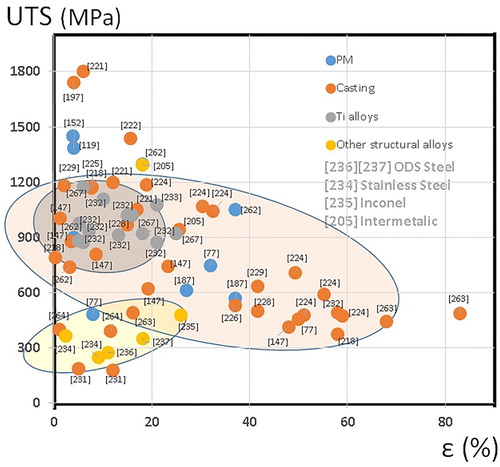
Figure 19. Potentiodynamic polarisation curves of the as-sintered E2 (CuZr alloy) and E5 (CuZrAlTiNi HEA) bulk alloys at different sintering temperatures (from 520 °C to 959 °C), from [Citation104].
![Figure 19. Potentiodynamic polarisation curves of the as-sintered E2 (CuZr alloy) and E5 (CuZrAlTiNi HEA) bulk alloys at different sintering temperatures (from 520 °C to 959 °C), from [Citation104].](/cms/asset/4b960aaf-e968-475a-b07a-9451d5a10b7f/ypom_a_1584454_f0019_oc.jpg)
Table 5. Corrosion parameters of the samples tested (as-sintered E2 -CuZr alloy- and E5 -CuZrAlTiNi HEA- bulk alloys at different sintering temperatures -from 520 to 959°C-, in a sea water solution, from [Citation104].
Figure 20. Magnetic hysteresis curves of the CoCrFeNiMn HEAs measured at room temperature, from [Citation105].
![Figure 20. Magnetic hysteresis curves of the CoCrFeNiMn HEAs measured at room temperature, from [Citation105].](/cms/asset/d680e45a-fb45-4939-9d46-f28ca30e40d6/ypom_a_1584454_f0020_oc.jpg)
Figure 21. SEM images of the as-milled amorphous Al alloy powder (a), (b), the HEA gas-atomised particles and c) the composite; (d) magnified image corresponding to the area marked by the rectangular in (c), from [Citation81].
![Figure 21. SEM images of the as-milled amorphous Al alloy powder (a), (b), the HEA gas-atomised particles and c) the composite; (d) magnified image corresponding to the area marked by the rectangular in (c), from [Citation81].](/cms/asset/ad7afb8f-0433-48bf-87cf-780a31191bca/ypom_a_1584454_f0021_oc.jpg)
Figure 22. Ultimate compression strength vs. deformation at fracture for some HEA base composites and HEAs.
Figure 23. Hardness vs. fracture toughness of different cermets and cemented carbides made with HEA binders, and some conventional Co-based materials for comparison.
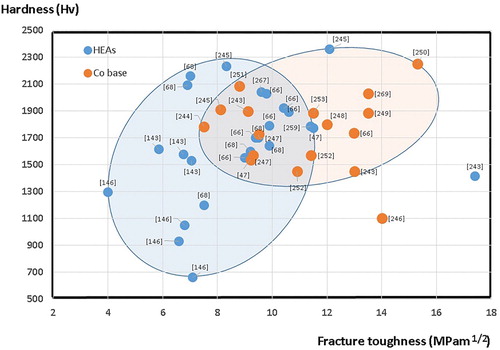
Figure 24. The pseudo binary phase diagram of the (CoCrFeNi)-Mo alloy system. The star stands for a mixture of the FCC, σ and µ phases in the Mox (x = 0.1, 0.2 and 0.3) at 973 K (700 °C), 1073 K (800 °C), 1173 K (900 °C) and 1273 K (1000 °C). From [Citation147].
![Figure 24. The pseudo binary phase diagram of the (CoCrFeNi)-Mo alloy system. The star stands for a mixture of the FCC, σ and µ phases in the Mox (x = 0.1, 0.2 and 0.3) at 973 K (700 °C), 1073 K (800 °C), 1173 K (900 °C) and 1273 K (1000 °C). From [Citation147].](/cms/asset/932cea5c-aa6f-459c-98c5-472ee2f1f3c7/ypom_a_1584454_f0024_oc.jpg)
Figure 25. Microstructures of the SPSed AlCoCrFeNiHEA:(a) low-magnification back-scattered electron image (BEI), (b) high-magnification secondary electron image (SEI) of the BCC phase, from [Citation80].
![Figure 25. Microstructures of the SPSed AlCoCrFeNiHEA:(a) low-magnification back-scattered electron image (BEI), (b) high-magnification secondary electron image (SEI) of the BCC phase, from [Citation80].](/cms/asset/fb5276f9-b2a7-45de-bc31-8629845f6a38/ypom_a_1584454_f0025_ob.jpg)
Figure 26. Cooling curve transformation diagram for Al0.85CoCrFeNi HEA, from[Citation65].
![Figure 26. Cooling curve transformation diagram for Al0.85CoCrFeNi HEA, from[Citation65].](/cms/asset/a138bcbb-5815-44f2-925f-fc59121df896/ypom_a_1584454_f0026_oc.jpg)