Figures & data
Figure 1. EBSD maps depicting the deformation effects of plain powder and green samples compacted at 400 and 800 MPa, respectively. Left column (a, c, e): Grain boundary maps with low-angle grain boundaries as red lines and high-angle grain boundaries as black lines. Right column (b, d, f): KAM maps illustrating the prevalence of small (θ < 2°) misorientations.
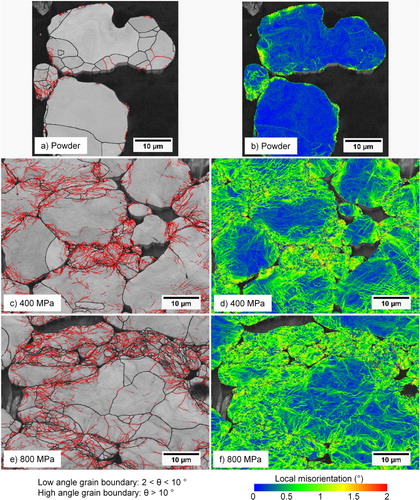
Figure 2. Low-temperature isothermal sintering of samples compacted at three different pressures and sintered at different temperatures; (a) 600°C, (b) 700°C, (c) 800°C.
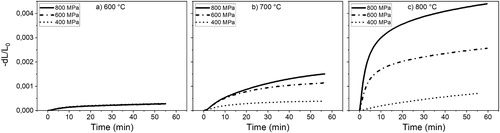
Figure 3. Fractographic images of compacts sintered at 700°C: (a) 400 MPa, (b) 600 MPa, (c) 800 MPa, (d) 800 MPa, N2.
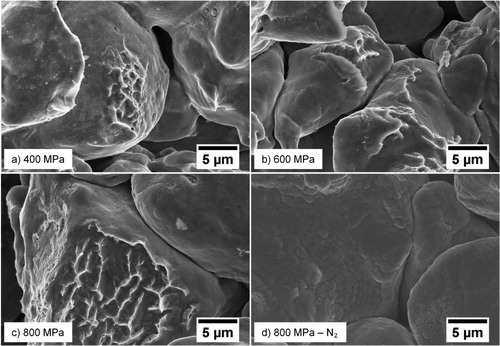
Figure 4. Fe75 sintering cycle matrix. (a) Varying compaction pressure at 10°C min–1, (b) with added carbon. (c) Isothermal shrinkage at 1350°C for four sintering conditions, (d) with added carbon.
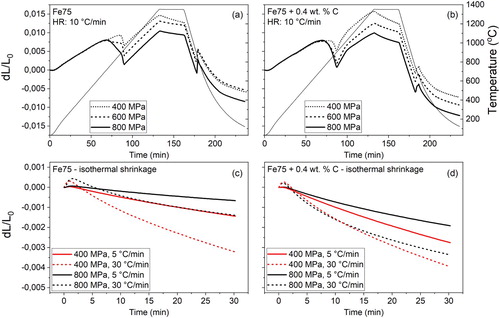
Figure 5. Sintering curves of Fe75 and Fe75+C compacted at 800 MPa and heated at 10°C min–1. The CTE references are included as dotted lines.
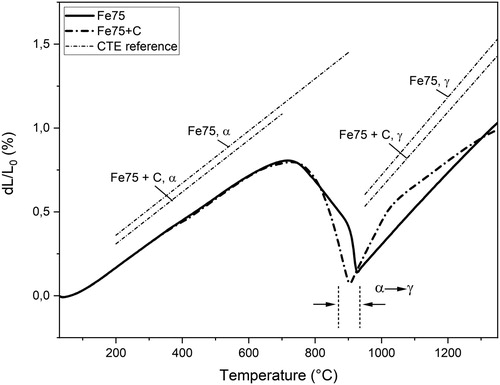
Table 1. Sintering shrinkages in different regions of Fe45, Fe45 + C, Fe75 and Fe75 + C samples.
Figure 6. Sintering curves of Fe75 and Fe75+C compacted at 800 MPa and heated at 10°C min–1. Methodology for determining the sintering shrinkage in each region.
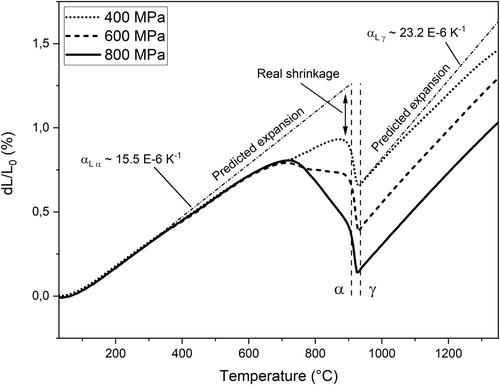
Figure 7. Fractional shrinkage in each region of (a) Fe75 and (b) Fe75 + C samples.
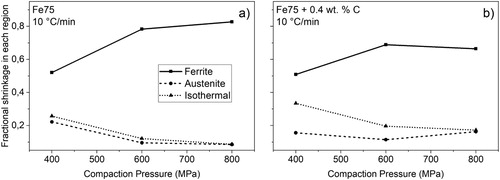
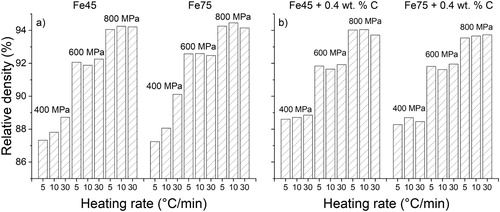
Figure 8. Final sintered densities of (a) plain Fe45 and Fe75 and (b) carbon-containing Fe45 and Fe75 samples.