
Figures & data
Table 1. Chemical composition of the examined low-alloy steel powder grades in wt-%.
Table 2. Particle size distribution of the examined low-alloy steel powder grades.
Figure 1. OM image of the unetched top layer found in an AISI 4140LC specimen produced at 160 J mm−3 using a 140 W laser power. Measurement of the melt pool depth was conducted by measuring the depth of this unetched top layer using ImageJ software. An example measurement of the melt depth (as well as the corresponding value) is included in the figure using a black line and text.
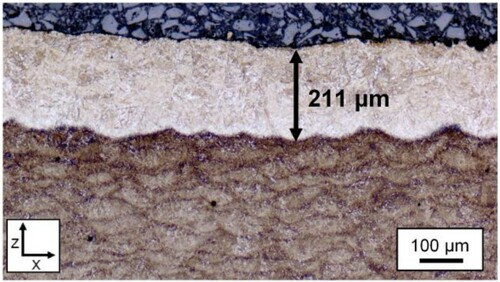
Table 3. VED chosen for porosity image analysis. All listed specimens were fabricated using a 140 W laser power.
Figure 2. Relative density as a function of VED for each examined low-alloy steel. Marked areas (I, II or III) denote the defined process regions, where the segmentation of each region is marked using dashed box lines. Region II represents the ideal processing window where specimen densities of >99.8% are produced.
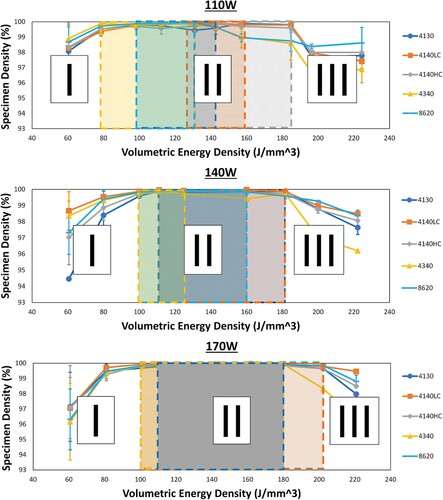
Figure 3. (a) Lack of fusion porosity in an AISI 4140HC specimen produced at 60 J mm−3 using a 170 W laser power. (b) Higher magnification of image (a). (c) Higher magnification of image (a) showing a lack of fusion porosity within a partially sintered powder particle (outlined by the black box).
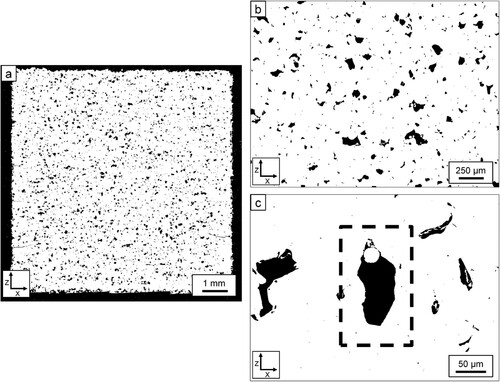
Figure 4. (a) Top surface of an AISI 4140LC specimen produced at 60 J mm−3 using a 170 W laser power. Here, the top surface is highly irregular, with many cavities and pores between deposited melt tracks. (b) Top surface in an AISI 4140LC specimen produced at 120 J mm−3 using a 170 W laser power. Here, the top surface is less irregular and is free of any large cavities or pores between deposited melt tracks.
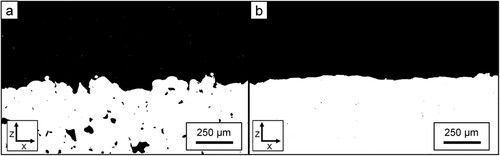
Figure 5. (a) Keyhole porosity in an AISI 4340 steel specimen produced at 185 J mm−3 using a 110 W laser power. (b) Example of keyhole pores at the bottom of melt pools in an AISI 4340 specimen produced at 140 J mm−3 using a 110 W laser power.
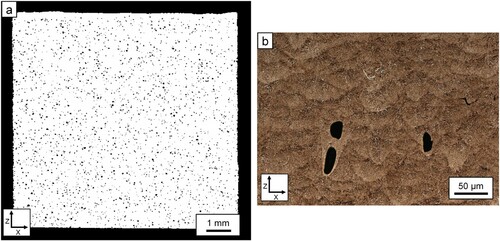
Figure 6. (a) High-density (>99.8%) AISI 8620 specimen produced at 110 J mm−3 using a 110 W laser power. (b) Higher magnification of specimen from (a) showing the presence of minimal porosity.
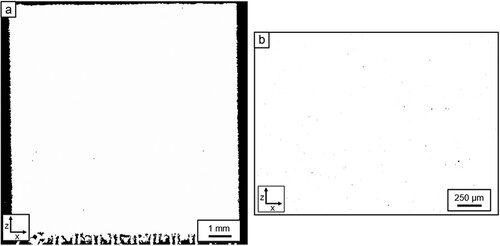
Figure 7. Histogram and cumulative porosity area for low-alloy steel specimens from each process region.
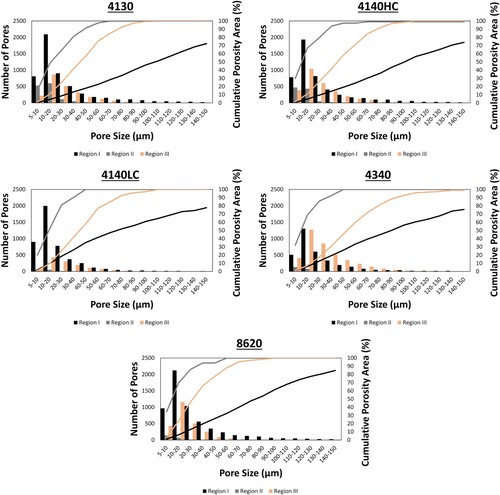
Table 4. Average pore characteristics from each process region for each examined low-alloy steel.
Figure 8. As-built microstructure for (a) AISI 4140LC alloy specimen produced at 110 J mm−3 using a 140 W laser power, (b) AISI 4130 alloy specimen produced at 110 J mm−3 using a 170 W laser power, (c) AISI 4140HC alloy specimen produced at 100 J mm−3 using a 110 W laser power, (d) AISI 4340 alloy specimen produced at 110 J mm−3 using a 170 W laser power and (e) AISI 8620 alloy specimen produced at 100 J mm3 using a 110 W laser power.
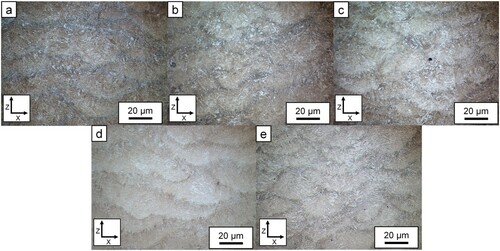
Figure 9. SEM images of tempered lath martensite in (a,b) an AISI 4130 alloy specimen produced at 80 J mm−3 using a 110 W laser power, (c,d) an AISI 4140HC alloy specimen produced at 200 J mm−3 using a 140 W laser power and (e,f) an AISI 4340 alloy specimen produced at 140 J mm−3 using a 170 W laser power.
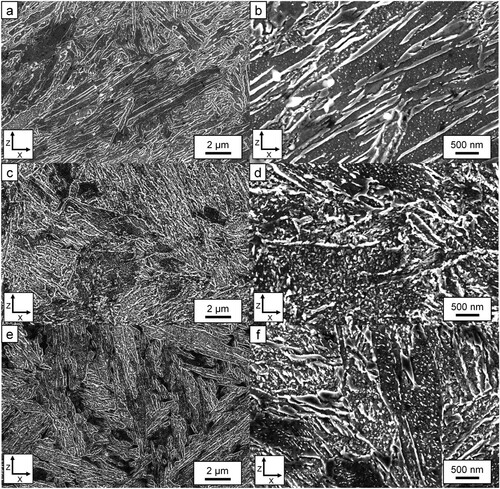
Figure 10. Bulk hardness (HV10) for each low-alloy steel in the as-built, quenched, and quenched and tempered conditions.
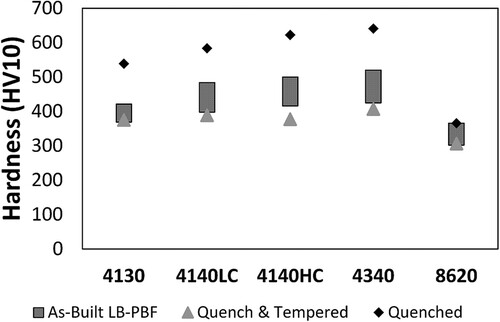
Figure 11. (a) Cracking defects in an unetched AISI 4340 specimen produced at 80 J mm−3 using a 140 W laser power. (b) Etched, higher magnification image of a crack from (a).
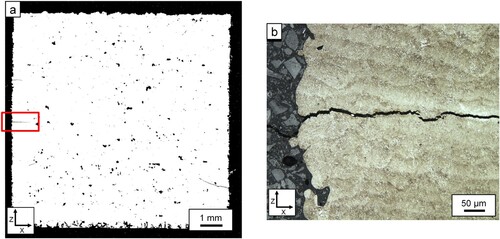
Figure 12. Fracture surface of AISI 4340 specimens produced at 80 J mm−3 using a 170 W laser power, showing transgranular decohesion facets.
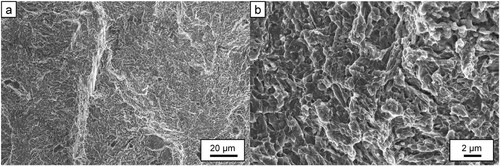
Table 5. Average microhardness (HV0.1) across the crack interface.
Figure 13. Evolution of cold cracking in the AISI 4140LC alloy as a function of VED for specimens produced with a laser power of 140 W.
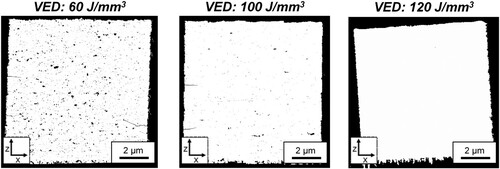
Table 6. Maximum VED at which cold cracking occurred in the AISI 4140LC, 4140HC and 4340 alloys.
Figure 14. Variation in bulk hardness and melt pool depth as a function of the VED. Hardness is displayed as a scatter plot, while melt pool depth is displayed as a bar chart. The VEDs at which cold cracking occurred are indicated with fill.
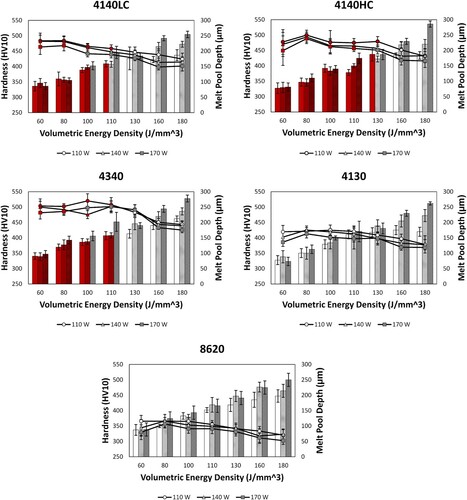
Table 7. VED ranges that produced high-density (>99.8%), crack-free specimens.