Figures & data
Table 1. Chemistry of the powder used for BJ samples manufacturing (wt-%).
Table 2. Properties of the experimental powder.
Table 3 . Printing process parameters used.
Figure 1. Schematic illustration of the experimental procedure followed in this study.
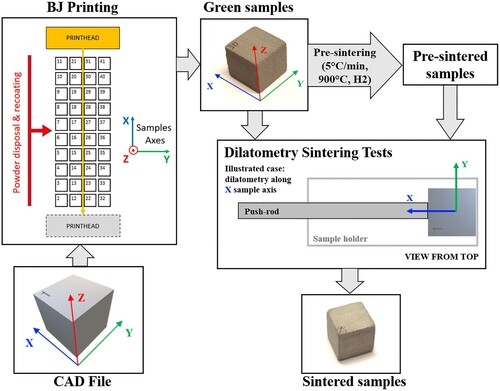
Table 4 . Sample’s ID and sintering parameters used for the dilatometry sintering tests.
Figure 2. Sintering curves from a green (G-1370C-X) and pre-sintered (P-1370C-X) sample sintered up to 1370°C and oriented along the X axis, plotted as a function of the temperature. Note that only the results from heating steps are showed in the figure.
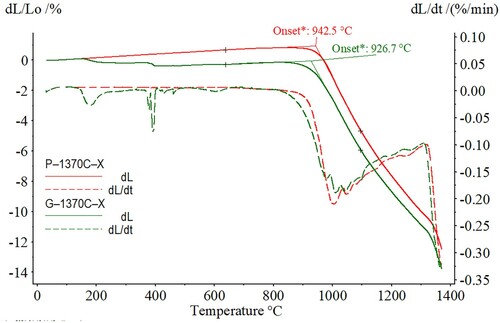
Figure 3. Multi-axial debinding data below 900°C, collected from dilatometry experiments along: Z axis, Y axis and X axis using green samples.
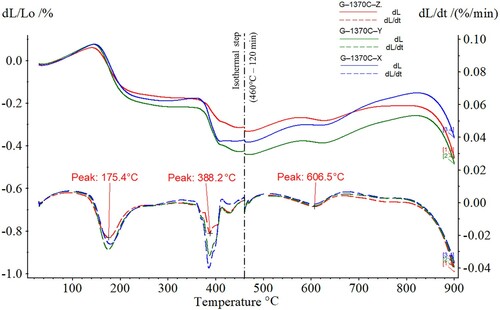
Figure 4. Multi-axial sintering data collected from sintering experiments along: Z axis, Y axis and X axis. Sintering curves based on dilatometry tests at: (a) 5°C/min heating up to 1370°C; (b) 5°C/min heating up to 1370°C, including a debinding step at 460°C for 120 min; (c) 10°C/min heating up to 1300°C. (d) Final shrinkages calculated from manual measurements of samples dimensions.
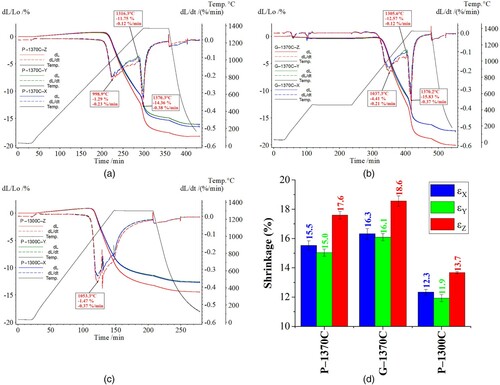
Figure 5. Evolution of anisotropic factors KY and KX during sintering, calculated from dilatometry results showed in : (a) 5°C/min heating up to 1370°C; (b) 5°C/min heating up to 1370°C, including a debinding step at 460°C for 120 min; (c) 10°C/min heating up to 1300°C. (d) Final anisotropic factors calculated from shrinkages measured manually showed in (d).
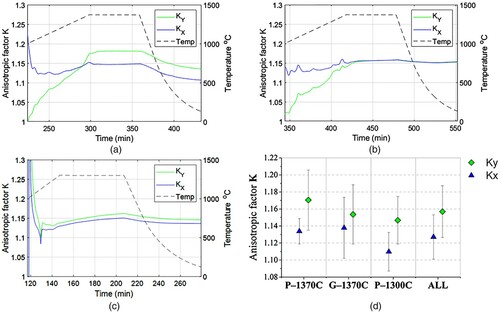
Figure 6. Sintering data collected from interrupted sintering tests performed at different temperatures. (a) Sintering curves from dilatometery tests performed at 5°C/min heating rate and interrupted at 1000°C, 1100°C, 1200°C and reference cycle from dilatometry tests of the G–1370C–Z sample. (b) Final shrinkages calculated from manual measurements of interrupted tests samples dimensions.
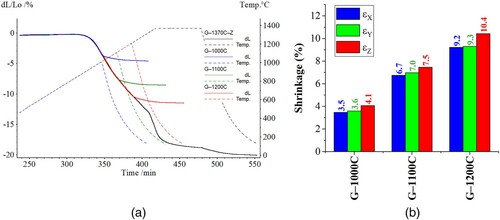
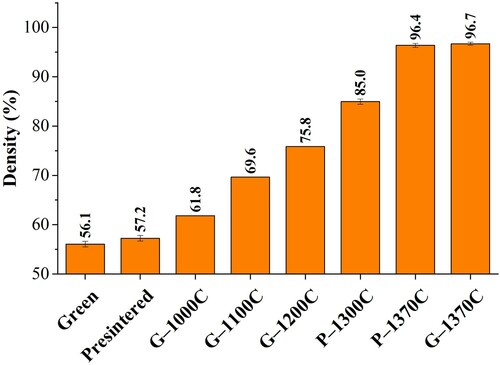
Figure 7. Relative densities for the samples at the green and pre-sintered states, together with the sintered densities of each sample’s sets sintered using the corresponding thermal routes. Average and standard deviation values are presented when various samples were subjected to the same thermal route.