Figures & data
Table 1. Chemistry of the 316L powder used for BJ samples manufacturing (wt.%).
Table 2. Properties of experimental powder.
Table 3. Sample’s ID and sintering parameters used for the dilatometry sintering tests [Citation21].
Figure 1. Relative densities for studied samples at the green and pre-sintered states, together with the sintered densities of each sample’s sets sintered using the corresponding thermal routes. Density values obtained by different measurement methods are presented: geometry-based, LOM-based and Archimedes method.
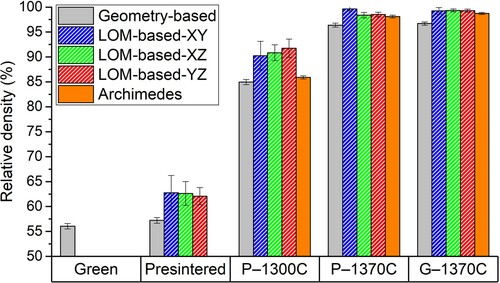
Figure 2. Optical micrographs of the BJ samples cross-sections made along the three quasi-orthogonal planes XY, XZ and YZ. Micrographs from pre-sintered state samples and sintered samples from each sample’s set: P-1300C, P-1370C and G-1370C. For illustration purposes, the corresponding cross-sections were done to the CAD geometry, where a layered structure was visualised by alternating coloured slices.
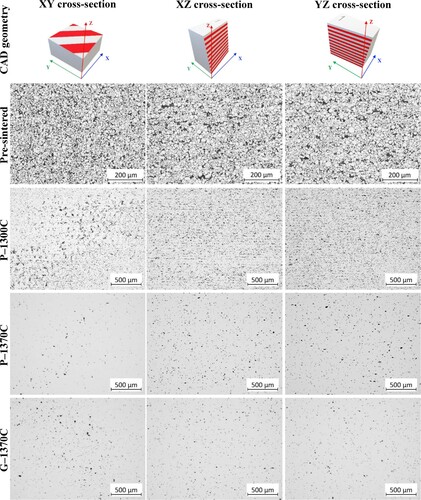
Figure 3. Phase maps obtained by EBSD in the XZ cross-sections from the samples set: (a) P-1300C and (b) P-1370C, where the FCC (austenite), BCC (δ-ferrite) and non-indexed (porosity) phases are shown in blue, red and black, respectively. Grain boundaries are shown as black lines, while twin boundaries within austenitic grains are shown in white.
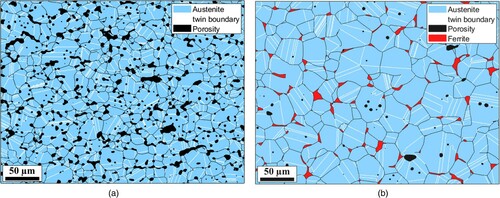
Figure 4. Normalised histograms and cumulative distributions of pore area as function of the equivalent diameter for each sample set: (a) P-1300C, (b) P-1370C and (c) G-1370C. The data sets correspond to the different cross-sectional data: XY, XZ and YZ.
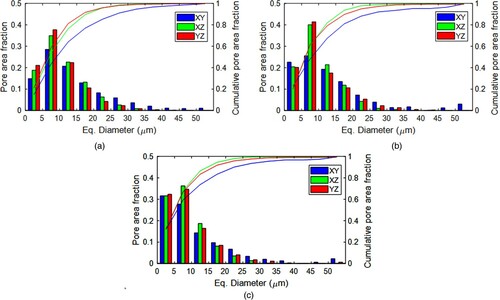
Figure 5. Normalised histograms and cumulative distributions of pores aspect ratio for each sample set: (a) P-1300C, (b) P-1370C and (c) G-1370C. The data sets correspond to the different cross-sectional data: XY, XZ and YZ.
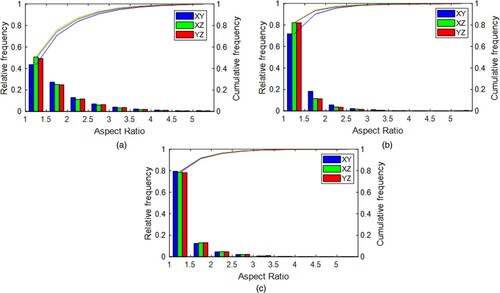
Figure 6. Normalised histograms and cumulative distributions of pores circularity for each sample set: (a) P-1300C, (b) P-1370C and (c) G-1370C. The data sets correspond to the different cross-sectional data: XY, XZ and YZ.
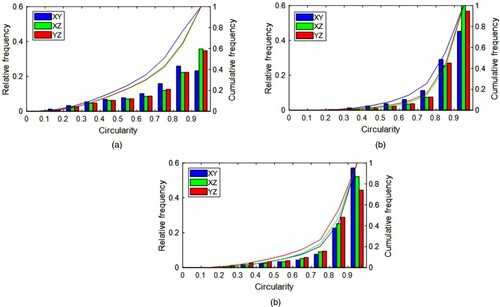
Figure 7. Histograms and cumulative distributions for each sample set of: (a) pore area as function of the equivalent diameter, (b) aspect ratio and (c) circularity.
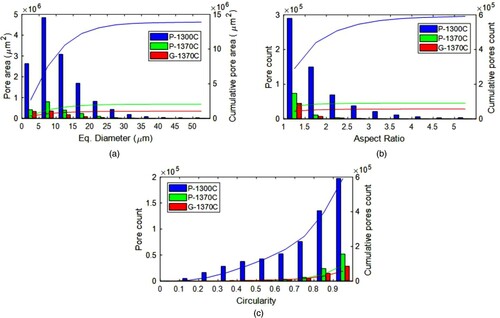
Figure 8. Microstructural characterisation and density results from samples subjected to interrupted sintering tests: (a) Optical micrographs of the BJ samples XZ cross-sections; (b) normalised histograms and cumulative distributions of pore area as function of the equivalent circle diameter (CED); pore aspect ratio and circularity; (c) geometry-based and LOM-based relative densities from sintered samples.
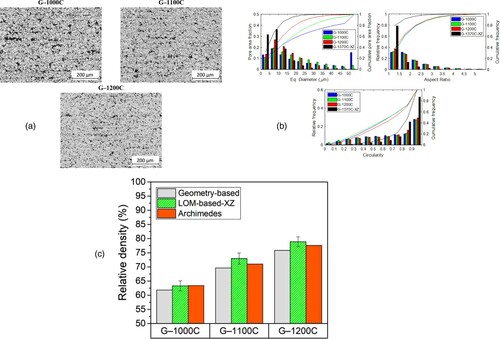
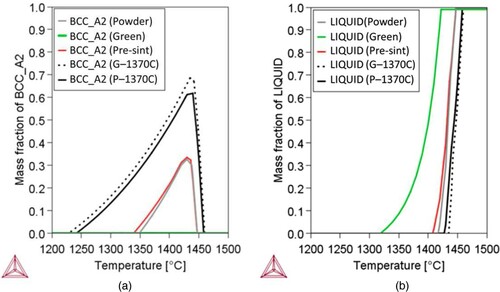
Figure 9. Element content of C, O, and N (wt.%) measured in samples at different stages of binder jetting: raw powder, green, pre-sintered at 900°C, sintered at 1370°C from initial pre-sintered sample (P-1370C) and sintered at 1370°C from initial green sample (G-1370C) specimens.
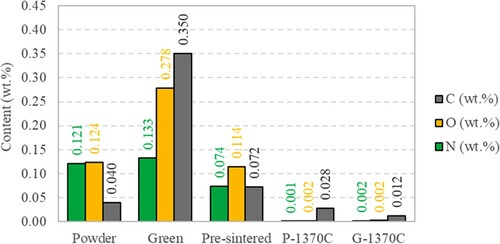
Figure 10. Effect of C, N and O content obtained from the chemical analysis for the different samples states on the equilibrium phase diagram: raw powder, green, pre-sintered at 900°C, sintered at 1370°C from initial pre-sintered sample (P-1370C) and sintered at 1370°C from initial green sample (G-1370C). Effect on (a) δ-ferrite phase equilibrium and (b) liquid phase equilibrium.