
Figures & data
Figure 1. Spreading tester [Citation32].
![Figure 1. Spreading tester [Citation32].](/cms/asset/c47aacad-eca1-46b2-af50-da32169f56d4/ypom_a_2023414_f0001_oc.jpg)
Figure 2. Internal setup of the feeder/builder [Citation32].
![Figure 2. Internal setup of the feeder/builder [Citation32].](/cms/asset/757c29f0-8d02-40b6-b550-3187611c9831/ypom_a_2023414_f0002_oc.jpg)
Figure 3. Mounted blade [Citation32].
![Figure 3. Mounted blade [Citation32].](/cms/asset/87af862f-44b3-4022-ab79-6d63cf95080b/ypom_a_2023414_f0003_oc.jpg)
Figure 4. Attachment for polymer blades [Citation32].
![Figure 4. Attachment for polymer blades [Citation32].](/cms/asset/6a94501f-2ac4-4ed1-a531-2e5a9886b02c/ypom_a_2023414_f0004_oc.jpg)
Figure 5. Mountable blades (1 and 2: polymer blades with different shapes; 3: HSS blade with rhombic shape) [Citation32].
![Figure 5. Mountable blades (1 and 2: polymer blades with different shapes; 3: HSS blade with rhombic shape) [Citation32].](/cms/asset/dc8ce594-756f-4a31-b558-4c800d8f64b8/ypom_a_2023414_f0005_oc.jpg)
Figure 6. Simplified spreading routine inspired by an EOS machine [Citation12].
![Figure 6. Simplified spreading routine inspired by an EOS machine [Citation12].](/cms/asset/c5d9888d-74eb-42a9-bc11-e70935ce9ba7/ypom_a_2023414_f0006_oc.jpg)
Figure 7. Simplified spreading routine inspired by a Concept Laser machine [Citation12].
![Figure 7. Simplified spreading routine inspired by a Concept Laser machine [Citation12].](/cms/asset/80f73efa-e556-4bfc-9129-92c32ded3464/ypom_a_2023414_f0007_oc.jpg)
Figure 8. Position of the examined spots [Citation15].
![Figure 8. Position of the examined spots [Citation15].](/cms/asset/c3792dd6-3a75-4666-96c8-42f7576c0af9/ypom_a_2023414_f0008_oc.jpg)
Figure 9. Sufficiently large (left) and too small (right) range to fit at least the smallest particle [Citation32].
![Figure 9. Sufficiently large (left) and too small (right) range to fit at least the smallest particle [Citation32].](/cms/asset/da33cdc3-9203-4e2d-ae4e-8d5f0154a60f/ypom_a_2023414_f0009_oc.jpg)
Figure 10. Special feature of the surface of a spread powder layer [Citation30].
![Figure 10. Special feature of the surface of a spread powder layer [Citation30].](/cms/asset/3c3857c2-9ec0-40c4-9d34-8a75eb35d90a/ypom_a_2023414_f0010_oc.jpg)
Figure 11. Different surfaces with the respective lowest and highest marked particle and the resulting deviation of height (ΔHpar).

Figure 12. Cumulative distribution of the height of all found particles referring to the exemplary surfaces illustrated in with the respective marked first (Q1) and third quartiles (Q3).
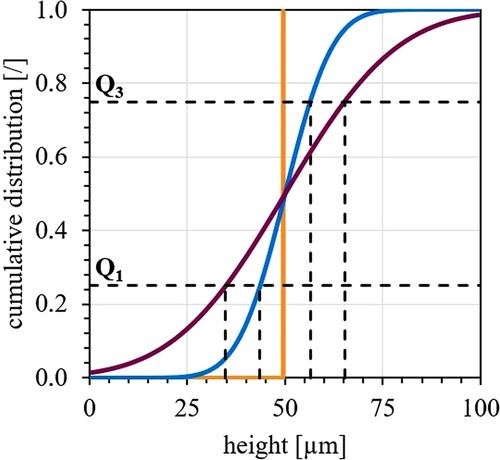
Figure 13. Detailed triangulation of four pixels (left) and different ways of triangulation (right) [Citation32].
![Figure 13. Detailed triangulation of four pixels (left) and different ways of triangulation (right) [Citation32].](/cms/asset/5ff90740-d120-44db-9bfd-7c0890793e95/ypom_a_2023414_f0013_oc.jpg)
Figure 14. Schematically description of the equalising volume (Vequ).
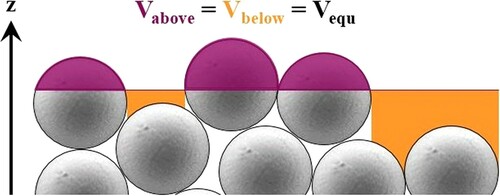
Figure 15. Cross-section of the builder.
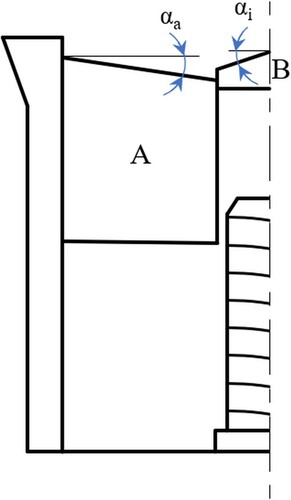
Figure 16. Enlarged cross-section of the builder with the marked spots for measuring the height differences in red (hcylinder, hplatform and hcover) and the marked additional volumes (Vp, and Vc).
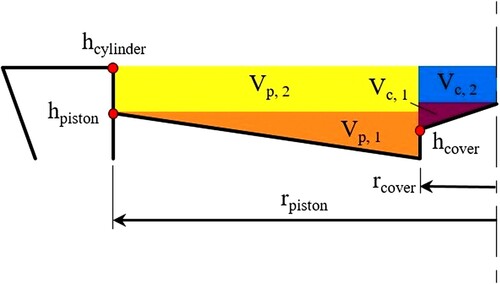
Figure 17. Dummy for measuring the surface coverage of a single spread powder layer.
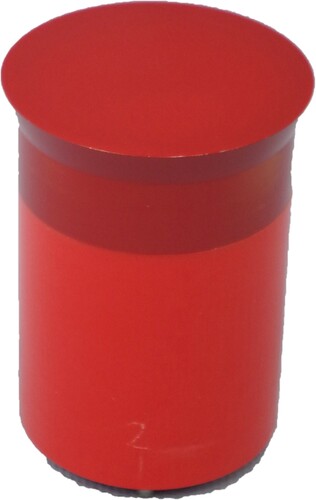
Figure 18. Technical drawing of the upper part of the dummy.
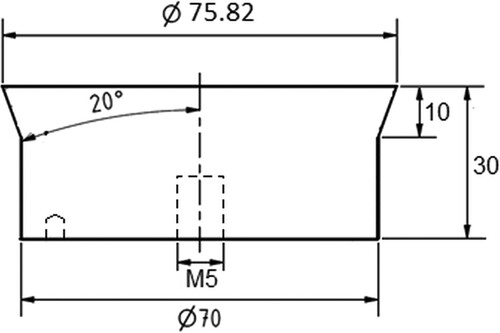
Figure 19. Cube-shaped RGB colour space (left) and cone-shaped HSV colour space (right).
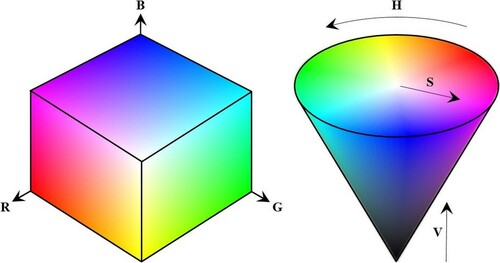
Figure 20. Crisp two-dimensional image (left) and masked B/W image (right).
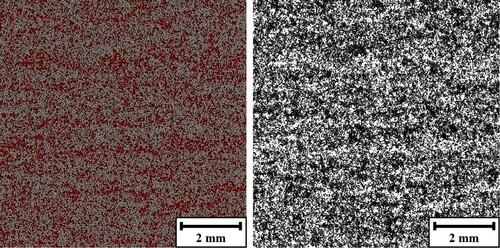
Figure 21. Crisp two-dimensional image of a magnified area from (left) and the corresponding masked B/W image (right).
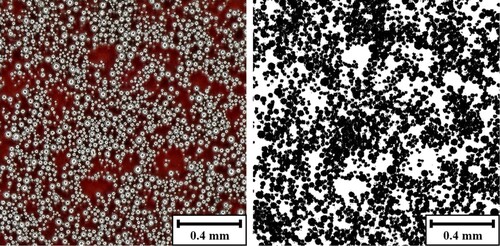
Figure 22. SEM image of the plasma spheroidised IN718 powder used.
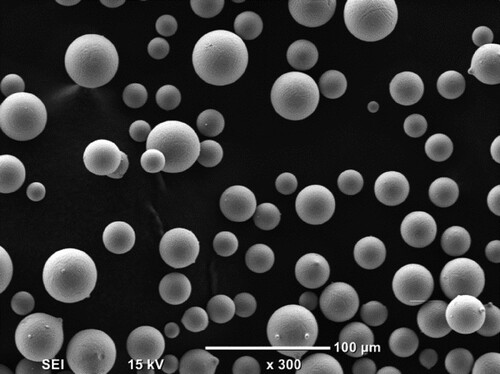
Table 1. Volume-related characteristic d-values (d10, 3, d50, 3, d90, 3) and volume-related sphericity (SPHT3).
Table 2. Basic powder characteristics (FR = flow rate; ADH = apparent density measured using a Hall funnel; ADA = apparent density measured using an Arnold Meter; TD = tap density) of the plasma spheroidised IN718 powder used.
Table 3. Surface roughness-related (ΔHpar, ΔQpar, Vequ, A, npar) arithmetic mean values (xi) including their standard deviation (si) of the five single measurements and the weighted mean value , its standard deviation
and relative standard deviation (RSD) calculated from this.
Table 4. Arithmetic mean values (xi) including their standard deviation (si) of the surface coverage (ψ) of the five single measurements and the weighted mean value , its standard deviation
and relative standard deviation (RSD) calculated from this.
Table 5. Powder bed density (ρpb) of the five single measurements (xi), arithmetic mean value (xave), its standard deviation (si) and relative standard deviation (RSD).
Table 6. Measured filling characteristics of the plasma spheroidised IN718 powder used listed in increasing order: ADH = apparent density measured using a Hall funnel; ρpb, EOS = powder bed density measured using an EOS-inspired spreading strategy; ADA = apparent density measured using an Arnold Meter; ρpb, CL = powder bed density measured using a Concept Laser-inspired spreading strategy; TD = tap density.