Figures & data
Table 1. Composition and properties of the HEC-Me samples.
Figure 1. Length change of the HEC-24 vol-% binder composites during sintering, (a) overview, (b) initial stage of sintering up to 1000°C.
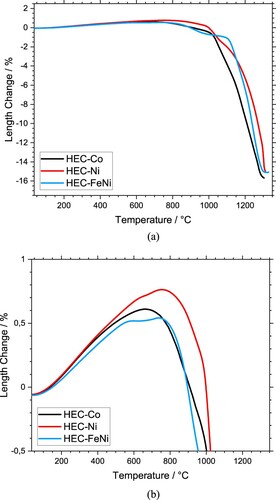
Figure 2. Length change rate of the HEC-24 vol-% binder composites during sintering.
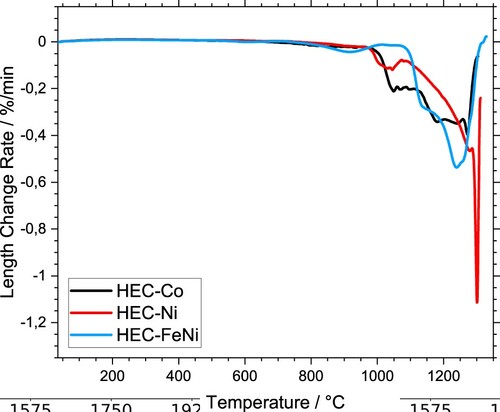
Figure 3. Mass change of the HEC-24 vol-% binder composites during sintering, (a) mass loss and (b) mass change rate.
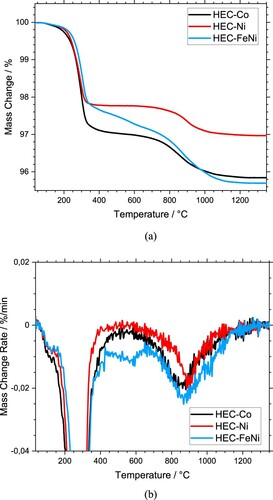
Figure 4. X-ray diffraction pattern of HEC-Co, HEC-Ni and HEC-FeNi hardmetals with 16 vol-% binder content in the range 2θ = 20–80°.
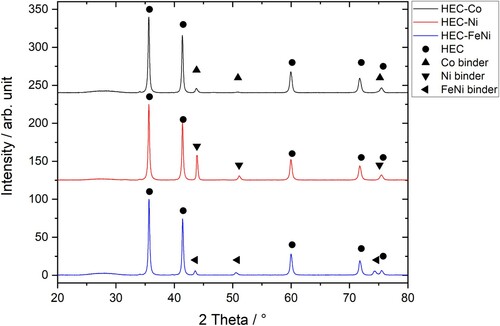
Table 2. Lattice parameters of the metallic binder phases.
Figure 5. SEM images of HEC-24 vol-% Co (left) and HEC-16 vol-% Co (right).
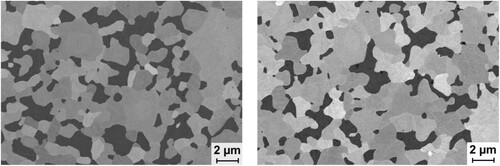
Figure 6. EDS mapping of HEC-16 vol-% Co.
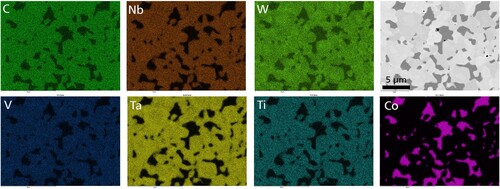
Figure 7. SEM images of HEC-24 vol-% Ni (left) and HEC-16 vol-% Ni (right).
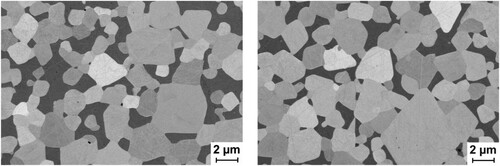
Figure 8. EDS mapping of HEC-16 vol-% Ni.
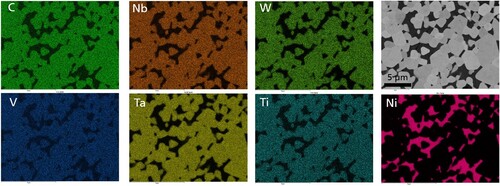
Figure 9. SEM images of HEC-24 vol-% FeNi (left) and HEC-16 vol-% FeNi (right)
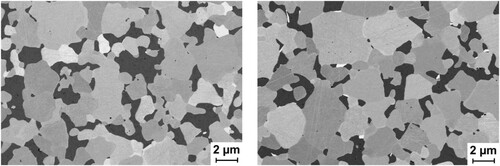
Figure 10. EDS mapping of HEC-16 vol-% FeNi.
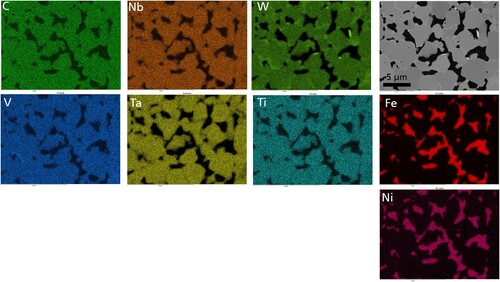
Figure 11. SEM images of WC-16 vol-% Co (WC-10 wt-% Co).
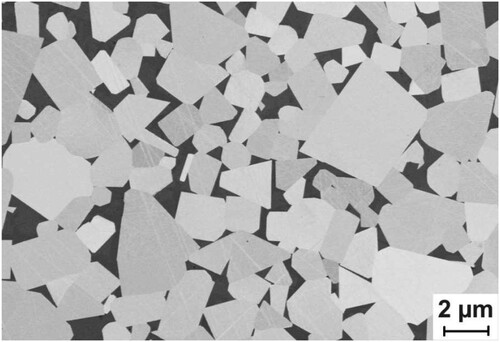
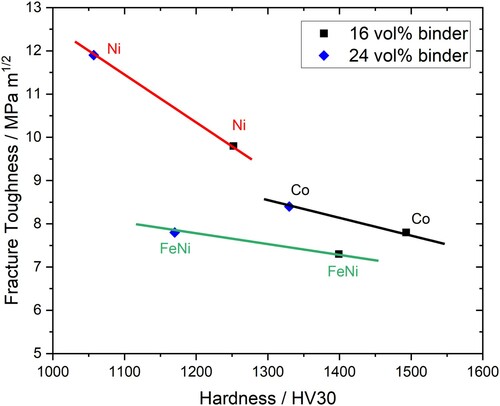
Figure 12. Fracture toughness vs. hardness HV30 of the HEC-Co, HEC-Ni and HEC-FeNi hardmetals with 16 and 24 vol-% binder content.