Figures & data
Table 1. Process conditions during gas atomisation used for powder synthesis.
Table 2. PBF-LB/M fabrication parameters.
Figure 1. Optical micrographs of additively manufactured samples, showing the cross-section along the build direction of (a) HP Vit101 and its representative; (b) EDX result; (c) HP remelted Vit101; and CPs (d) Vit101; (e) Vit101Si and (f) Vit101SiSn.
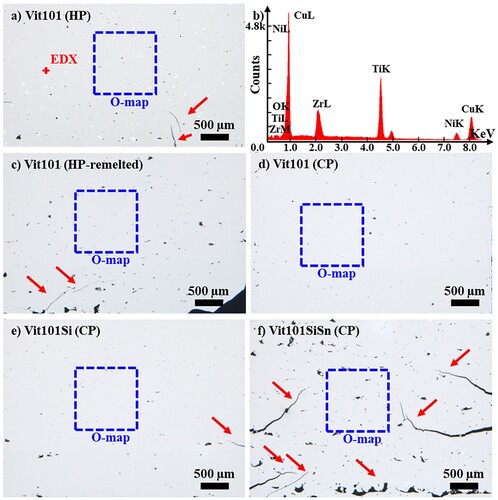
Figure 2. EMP composition elemental mappings of Oxygen for (a) HP Vit101; (b) HP remelted Vit101; and CPs (c) Vit101; (d) Vit101Si and (e) Vit101SiSn. The colour scale bar is attributed to all results.
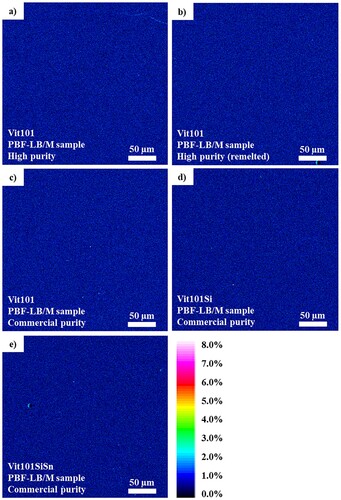
Figure 3. Oxygen uptake along the production chain of Cu–Ti-based metallic glasses via laser powder bed fusion using HP and CP feedstocks.
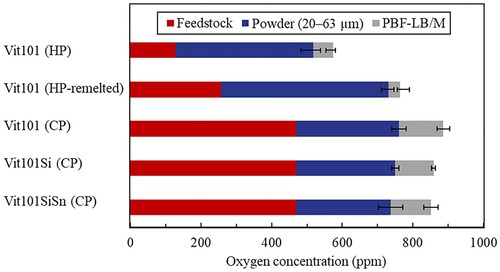
Figure 4. DSC Scans of CP powders of varied class sizes (<20 µm, 23–63 µm, > 63 µm) containing different oxygen concentrations of (a) Vit101 and (b) Vit101Si alloys.
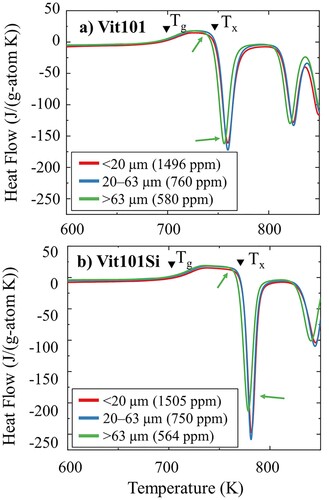
Figure 5. SEM images of the main steps regarding TEM lamella preparation of (a–d) powder and (e–f) PBF-LB/M samples of CP Vit101 alloy.
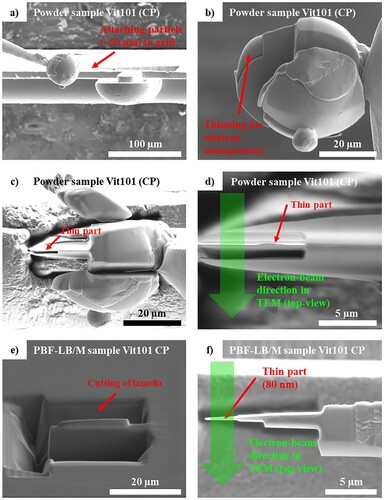
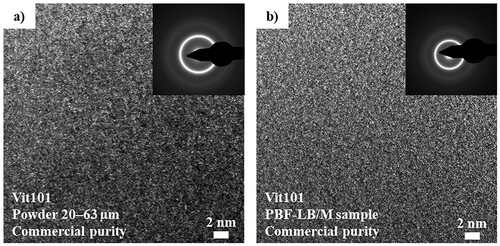
Figure 6. Representative high-resolution TEM of CP Vit101 (a) powder (20–63 µm) and (b) additively-manufactured sample evidence the lack of (nano-)crystallisation and cluster formation, indicating a fully amorphous phase formation.