Figures & data
Figure 1. Thermogravimetric curves for (a) CrA + Ni + C and (b) CrA + Ni + C + Fe NP.
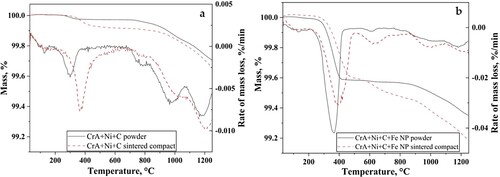
Table 1. Details of TG.
Table 2. Carbon and oxygen analysis.
Figure 2. Sintering curves of (a) CrA + Ni + C and CrA + Ni + C + Fe NP and (b) shrinkage rate curves during the heating cycle.
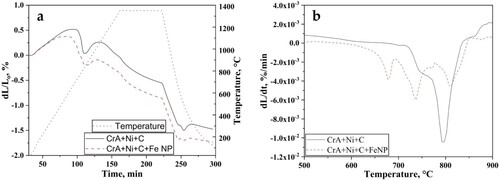
Figure 3. Plot showing green and sintered density.
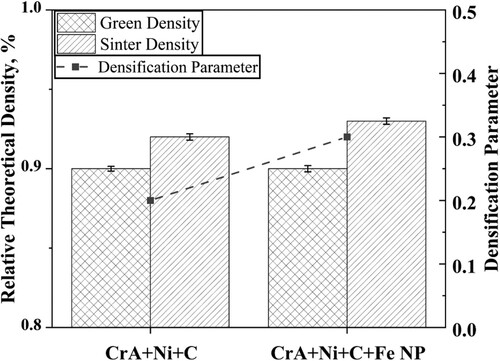
Figure 4. Optical micrographs of (a–c) CrA + Ni + C and (d–f) CrA + Ni + C + Fe NP sintered compact. Phases identified as P, B, M and F are pearlite, bainite, martensite and ferrite.
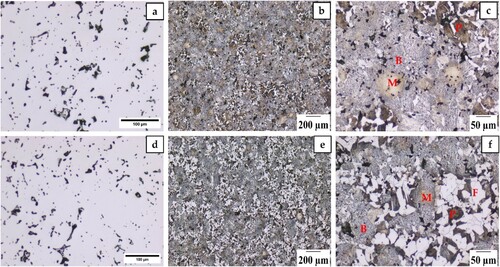
Figure 5. JMatPro calculations for the amount of phases with nickel in (a) CrA + Ni + C + Fe NP, (b) CrA + Ni + C and without nickel in (c) CrA + Ni + C + Fe NP and (d) CrA + Ni + C.
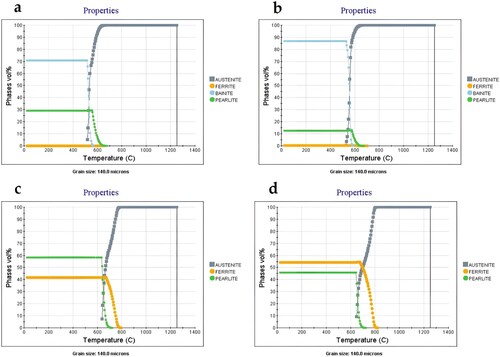
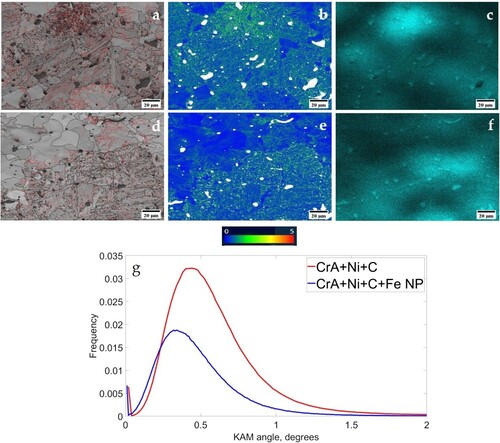
Figure 6. Band contrast along with KAM maps and EDS analysis of nickel for (a–c) CrA + Ni + C, (d–f) CrA + Ni + C + Fe NP sintered compacts and (g) misorientation frequency plots.