Figures & data
Figure 1. Layout of the conducted build jobs with 30 and 60 µm layer thicknesses in the EOS M290 machine.
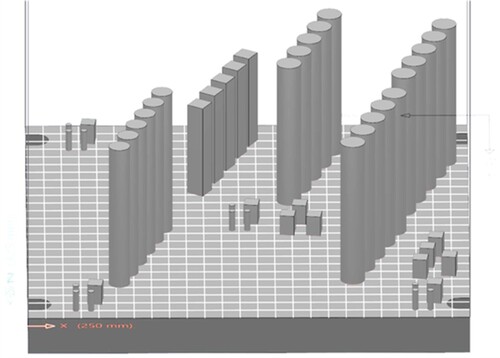
Figure 2. (a) Amount of collected spatters for the 30 and 60 µm layer thickness build jobs. (b) Oxygen, nitrogen and hydrogen contents measured in the Ti–6Al–4V virgin powder, the built parts and in the spatter collected in the outlet after the 30 and 60 µm layer thickness build jobs. For interpretation of the references to colour in this figure, the reader is referred to the online version of this article.
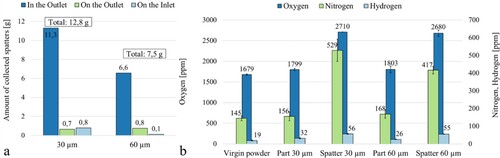
Figure 3. Scanning electron micrographs of (a–c) the virgin Ti–6Al–4V powder used, (d–f) the collected spatter in the outlet following the 30 µm layer thickness build job, (g–i) the 60 µm one.
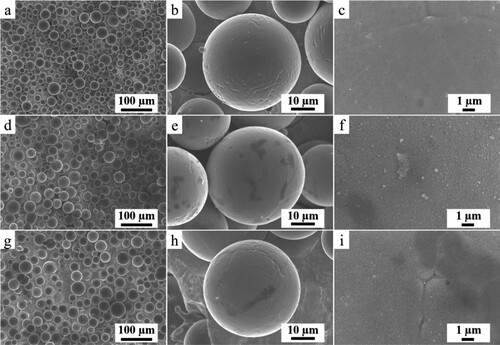
Figure 4. Nitrogen and oxygen solubility in Ti–6Al–4V in dependence on the temperature, phase diagrams calculated with Thermo-Calc 2021a and the TCTI2 database for Ti-Alloys v2.2. For interpretation of the references to colour in this figure, the reader is referred to the online version of this article.
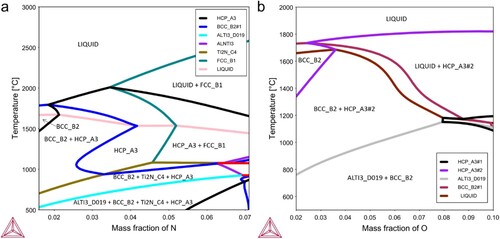
Figure 5. XPS survey scan of the virgin powder and of the spatters collected from the build jobs with 30 and 60 µm layer thickness at (a) as-received surface and (b) at 50 nm etched depth. For interpretation of the references to colour in this figure, the reader is referred to the online version of this article.
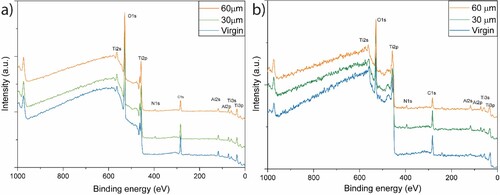
Figure 6. Depth profile comparison of Ti2p, Al2p and O1s narrow spectra of (a) virgin powder with spatters collected following the. (b) 30 μm and (c) 60 μm layer thickness build jobs. For interpretation of the references to colour in this figure, the reader is referred to the online version of this article.
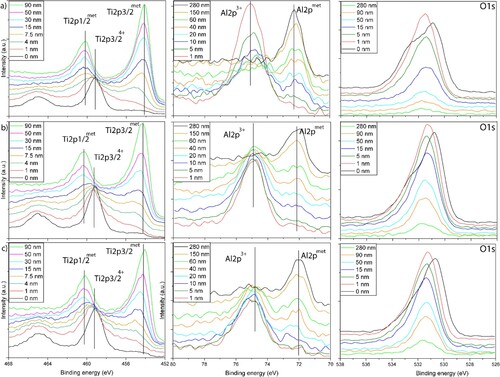
Figure 7. (a) Oxide layer thickness estimation based on the O1s profile for the virgin powder, the spatter generated with the 30 and 60 µm layer thickness. The thickness measurement is relative to Ta2O5 and Al2O3 which were used as a standard to determine the etch rate. (b) High-angle annular dark-field (HAADF) image of the cross-section of a Ti–6Al–4V spatter particle; (c) STEM-EDX line scan profile in atomic %, the red dotted arrow shows the direction of the line scan. For interpretation of the references to colour in this figure, the reader is referred to the online version of this article.
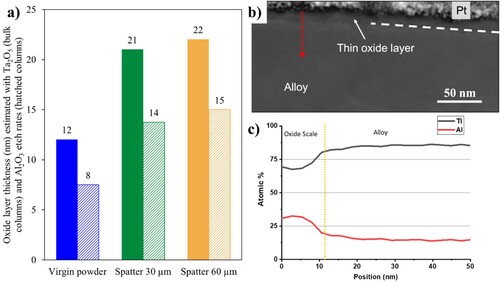
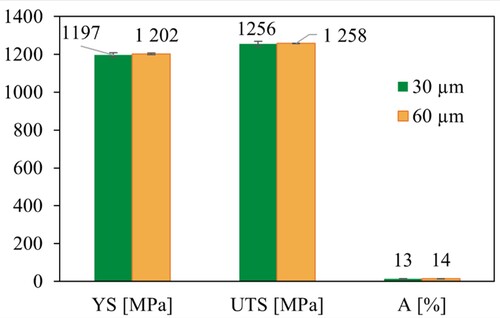
Figure 8. Tensile properties of stress-relieved samples built with standard laser parameters using a 30 and 60 µm layer thickness. For interpretation of the references to colour in this figure, the reader is referred to the online version of this article.