Figures & data
Table 1. Binder weight content (wt-%) used for feedstock preparation.
Figure 1. The FTIR spectra of feedstock (a) C-0, (b) EGMA-3 and (c) E40-3 with its respective binder constituent.
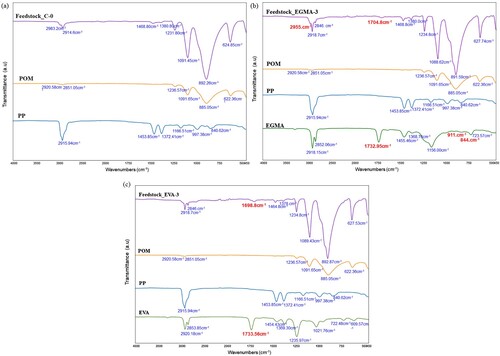
Figure 2. Possible interactions between POM and different compatibilisers in the binder system.
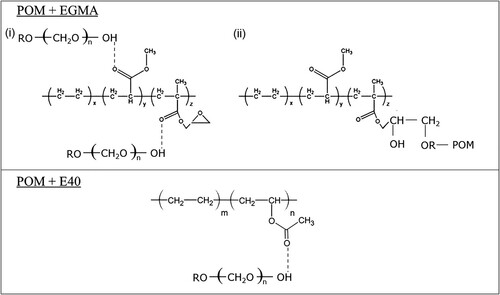
Figure 3. AFM phase images (with optical micrograph) of the POM-based binder system with formulation (a) C-0, (b) EGMA-3 and (c) E40-3.
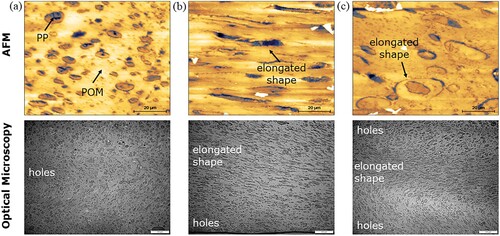
Figure 4. SEM fractographs on TITANIUM MIM feedstock (green parts) with binder formulation (a) C-0, (b) EGMA-3 and (c) E40-3.
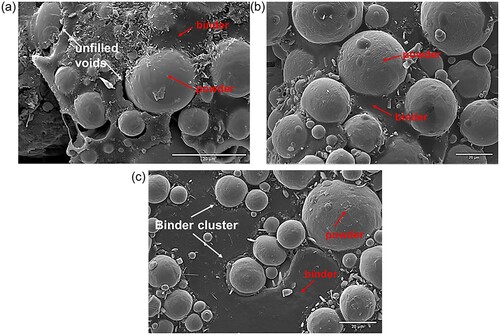
Table 2. Contact angle [o] and calculated free surface energy (10−3 J m−2) of the binder components on four different liquids (deionised water (DI), ethylene glycol (EG), di-iodomethane (DIM) and hexadecane (HD.)).
Table 3. The interfacial tension of the binder components using geometric and harmonic mean equations.
Figure 5. Contact angle of the POM-based binder system with different compatibiliser compositions. Note that F.C-0, F. EGMA-3 and F.E40-3 represent feedstock C-O, EGMA-3 and E40-3.
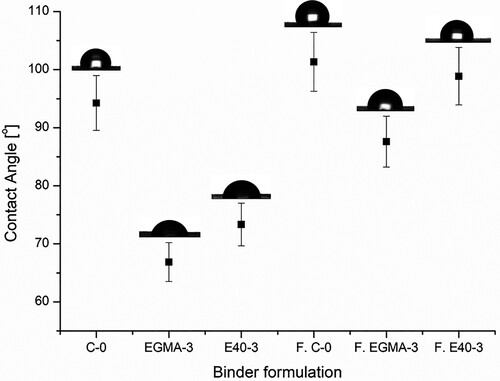
Table 4. Pycnometer density of feedstock C-0 and EGMA-3 at three different conditions.
Figure 6. The log-log plot of viscosity vs shear rate plot of feedstock (a) C-0 and (b) EGMA-3 in the temperature range of 180–200°C.
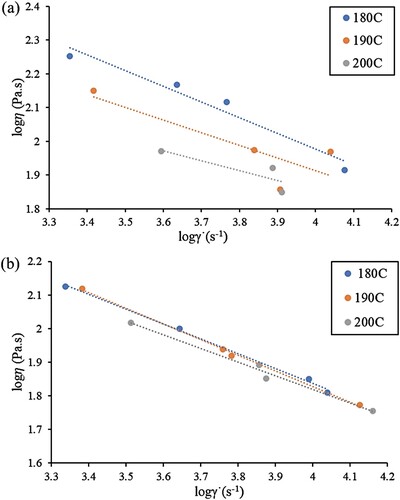
Figure 7. The comparison between the poor (a) and good (b) flow behaviour of feedstock. A stable feedstock will have a consistent flow and extrude nicely through the capillary die.
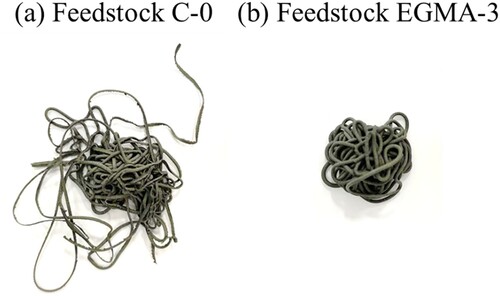
Table 5. The (n−1) value and moldability index for feedstock C-0 and EGMA-3 at three different temperatures.
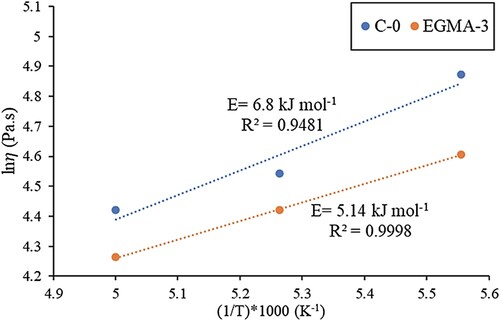
Figure 8. Temperature dependence of viscosity for feedstock C-0 and EGMA-3 at a shear rate of 6000 s−1.