Figures & data
Figure 1. Microstructures of Fe-2%Cr-0.7%C (Cr powder 45–63 µm) heated up to different temperatures and then rapidly cooled. Dilatometer Bähr, 10 K.min-1, vacuum, Nital etched.
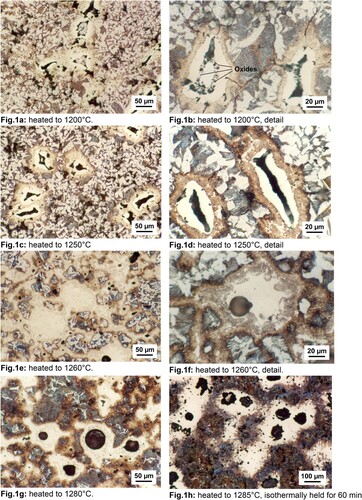
Figure 2. Microstructures of Fe-4%Cr-0.5%C (Cr powder d50∼45 µm) sintered in Ar at 900°C (a), 1120°C (b) and 1250°C (c). (Left) LOM Images of the cross sections. (Right) SEM image with EDS line scanning in the Cr-Fe interface.
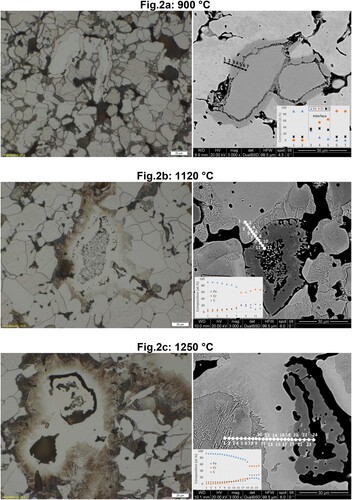
Figure 3. SEM images of the fracture surface of Fe-4.0Cr-0.5C compacts sintered in Ar at 900, 1120 and 1250°C for 1 hr.
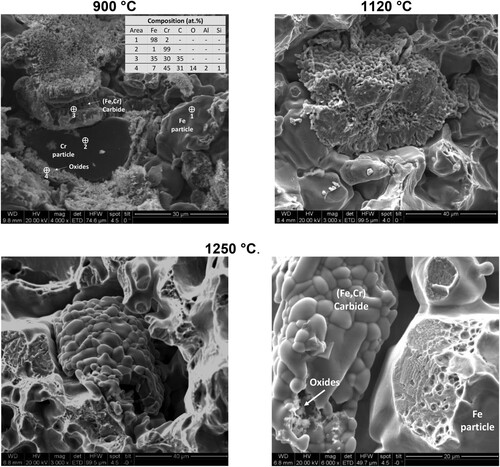
Figure 4. Evolution of phases at different temperatures for the two systems analysed experimentally in this study: Fe-4Cr-0.5C (a) and Fe-2Cr-0.7C (b).
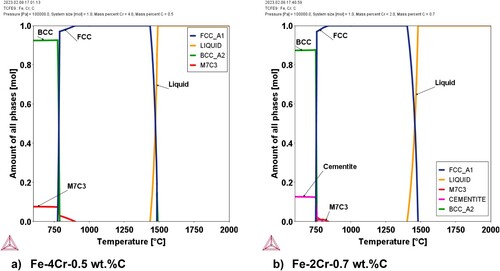
Figure 5. ThermoCalc calculations using the database TCFE9: (a) Isopleth Fe-Cr calculated for 3 wt.% C, (b) Isothermal section of the Fe-Cr-C system at 1260°C.
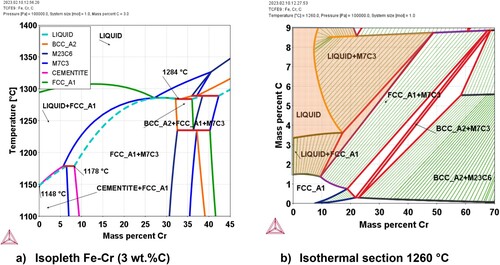
Figure 6. DTA analysis of different Fe-Cr-C mixes. (a) Fe-0.5C and Fe-4Cr-0.5C (Cr powder d50∼45 μm), (b) Mixes with different C contents (0.5 and 0.7 wt.%) and different particle sizes (fine-sieved below 25μm- and coarse-sieved above 63 μm-).
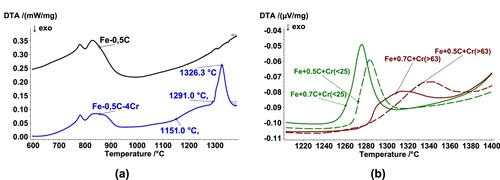
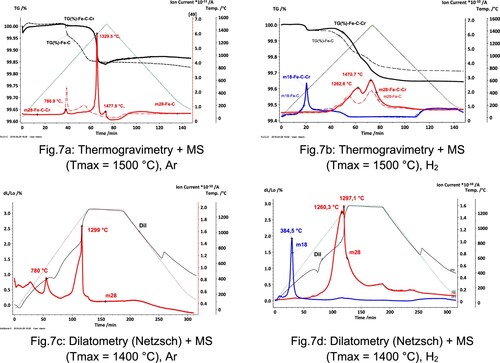
Figure 7. Thermal analysis of Fe-4Cr-0.5C steels in Ar and H2 atmospheres.