2,376
Views
19
CrossRef citations to date
0
Altmetric
ARTICLES

Disaster Declarations and Major Hazard Occurrences in the United StatesFootnote

, &
Pages 1-14 | Received 01 Aug 2006, Accepted 01 Jun 2007, Published online: 31 Jan 2008

Figures & data

Figure 1 Annual major hazard events and disaster declarations from 1965 to 2004.

Figure 1 Annual major hazard events and disaster declarations from 1965 to 2004.

Figure 2 Disasters 1965–2004: (A) Total number of major hazard events by county. (B) Total number of presidential disaster declarations (PDDs) by county.
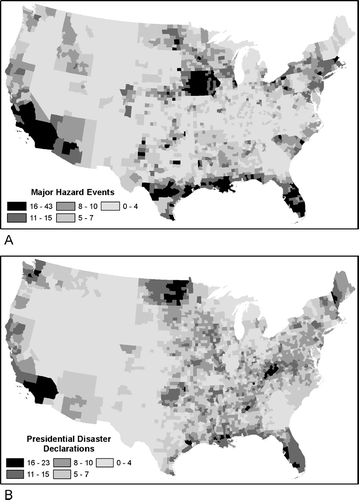
Figure 2 Disasters 1965–2004: (A) Total number of major hazard events by county. (B) Total number of presidential disaster declarations (PDDs) by county.

Figure 3 Local spatial association between presidential disaster declarations (PDDs) and major hazard events calculated using a bivariate local Moran's I.
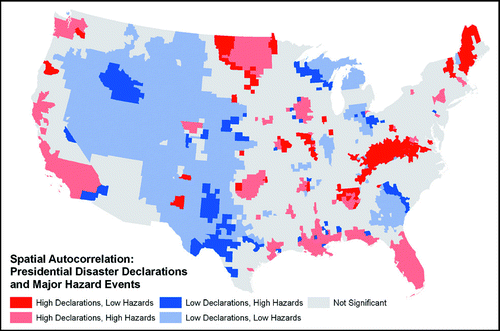
Figure 3 Local spatial association between presidential disaster declarations (PDDs) and major hazard events calculated using a bivariate local Moran's I.

Table 1 PDD success rates: 1965–2004

Table 2 Variables used to predict the number of presidential disaster declarations (PDDs) in the global regression model

Table 3 Two-county example from the geographically weighted regression model

Figure 4 R2 values of the local regressions conducted for each county using geographically weighted regression, with presidential disaster declarations as the dependent variable and major hazard events, state success rate, and regional success rate as the independent variables.
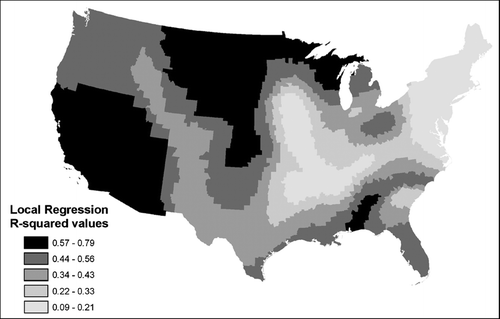
Figure 4 R2 values of the local regressions conducted for each county using geographically weighted regression, with presidential disaster declarations as the dependent variable and major hazard events, state success rate, and regional success rate as the independent variables.

Figure 5 Parameter values of the local regression conducted for each county using geographically weighted regression: (A) intercept values, (B) coefficients for the major hazard event variable, (C) coefficients for the state success rate variable, (D) coefficients for the regional success rate variable.
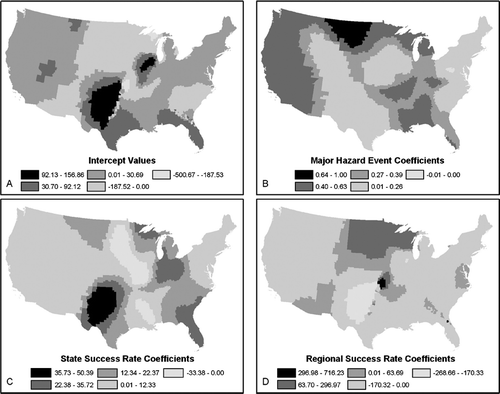
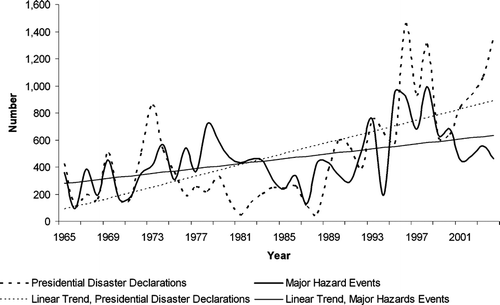
Figure 5 Parameter values of the local regression conducted for each county using geographically weighted regression: (A) intercept values, (B) coefficients for the major hazard event variable, (C) coefficients for the state success rate variable, (D) coefficients for the regional success rate variable.

Reprints and Corporate Permissions

Please note: Selecting permissions does not provide access to the full text of the article, please see our help page How do I view content?

To request a reprint or corporate permissions for this article, please click on the relevant link below:

Academic Permissions

Please note: Selecting permissions does not provide access to the full text of the article, please see our help page How do I view content?

Obtain permissions instantly via Rightslink by clicking on the button below:

If you are unable to obtain permissions via Rightslink, please complete and submit this Permissions form. For more information, please visit our Permissions help page.