6,383
Views
30
CrossRef citations to date
0
Altmetric
ARTICLES

The Geography of Religious Diversity in the United States

&
Pages 413-424 | Received 01 Sep 2006, Accepted 01 Dec 2007, Published online: 04 Jun 2008

Figures & data

Table 1 Distribution of major religions in the United States, 2000

Figure 1 Religious adherents as percentage of total county population, 2000. Intervals contain equal numbers of counties. (Source: Glenmary and Polis data.)
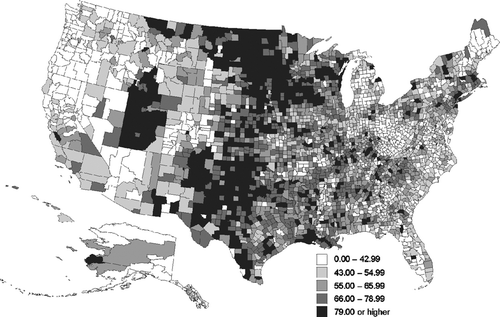
Figure 1 Religious adherents as percentage of total county population, 2000. Intervals contain equal numbers of counties. (Source: Glenmary and Polis data.)

Figure 2 Number of denominations per county, 2000. Intervals contain equal number of counties. (Source: Glenmary data.)
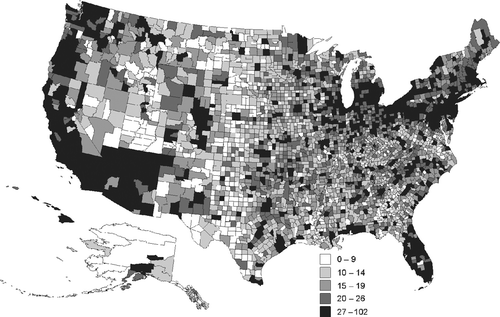
Figure 2 Number of denominations per county, 2000. Intervals contain equal number of counties. (Source: Glenmary data.)

Figure 3 Scatter diagram of number of denominations with county population, 2000. (Source: Glenmary data.)
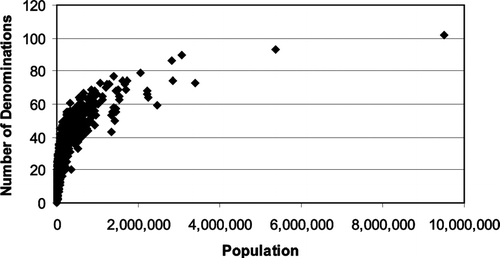
Figure 3 Scatter diagram of number of denominations with county population, 2000. (Source: Glenmary data.)

Table 2 Regression estimates

Figure 4 Residuals from regression of denominations with population, 2000. Intervals contain equal numbers of counties. (Source: Glenmary and Polis data.)
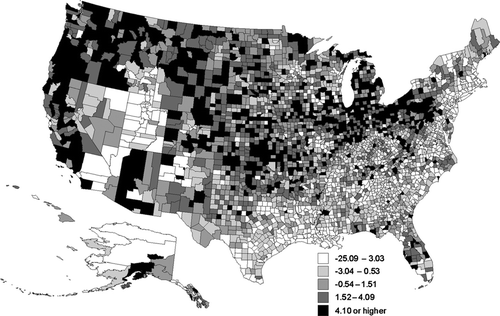
Figure 4 Residuals from regression of denominations with population, 2000. Intervals contain equal numbers of counties. (Source: Glenmary and Polis data.)

Figure 5 Share of total adherents in each county's largest denomination, 2000. Intervals contain equal number of counties. (Source: Authors, using Glenmary data.)
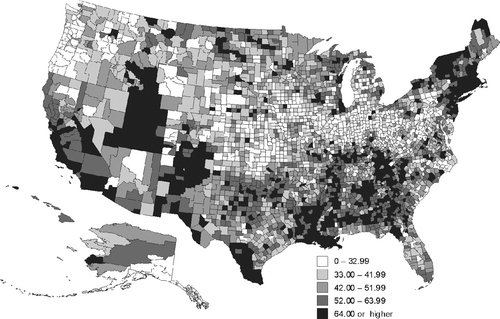
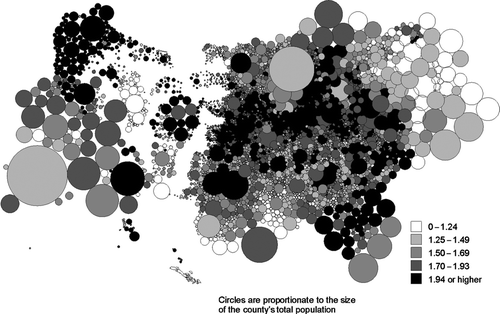
Figure 5 Share of total adherents in each county's largest denomination, 2000. Intervals contain equal number of counties. (Source: Authors, using Glenmary data.)
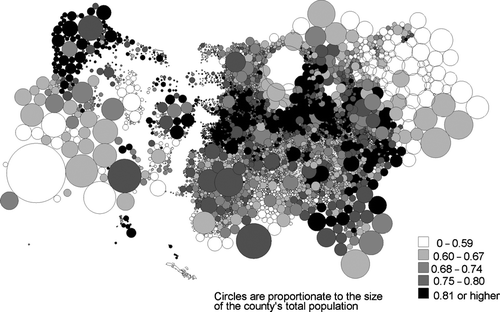
Figure 6 Shannon index of religious diversity in 2000, Dorling cartogram. Intervals contain equal numbers of counties. (Source: Glenmary and Polis data.)

Figure 6 Shannon index of religious diversity in 2000, Dorling cartogram. Intervals contain equal numbers of counties. (Source: Glenmary and Polis data.)

Figure 7 Simpson index of religious diversity in 2000, Dorling cartogram. Intervals contain equal number of counties. (Source: Glenmary and Polis data.)

Figure 7 Simpson index of religious diversity in 2000, Dorling cartogram. Intervals contain equal number of counties. (Source: Glenmary and Polis data.)

Reprints and Corporate Permissions

Please note: Selecting permissions does not provide access to the full text of the article, please see our help page How do I view content?

To request a reprint or corporate permissions for this article, please click on the relevant link below:

Academic Permissions

Please note: Selecting permissions does not provide access to the full text of the article, please see our help page How do I view content?

Obtain permissions instantly via Rightslink by clicking on the button below:

If you are unable to obtain permissions via Rightslink, please complete and submit this Permissions form. For more information, please visit our Permissions help page.