Figures & data
Figure 1 Original sketch map example from one interview subject (“Hank”) in Columbus, Ohio, with coded symbology of residence, employment, and commuting experiences. (Color figure available online.)
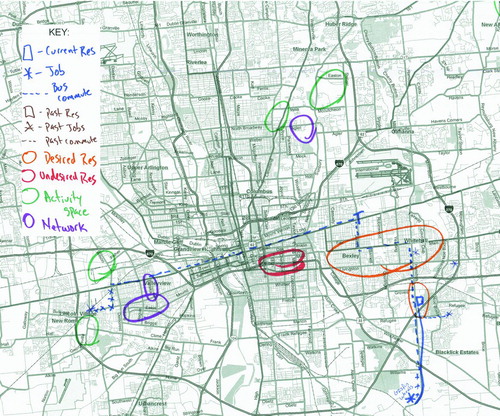
Figure 2 Digitized point, line, and polygon features of one sketch map in Columbus, Ohio. (Color figure available online.)
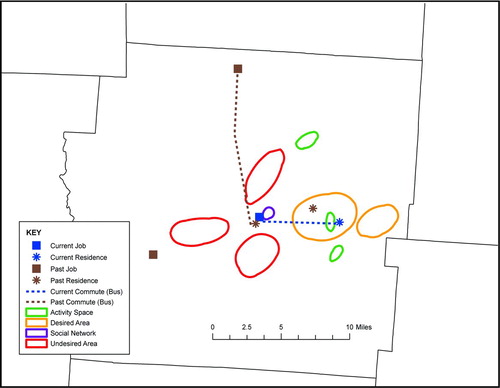
Figure 3 Composite map aggregating spatial data of residential and employment locations collected from thirty interview participants in Columbus, Ohio. Source: Boschmann (Citation2011). (Color figure available online.)
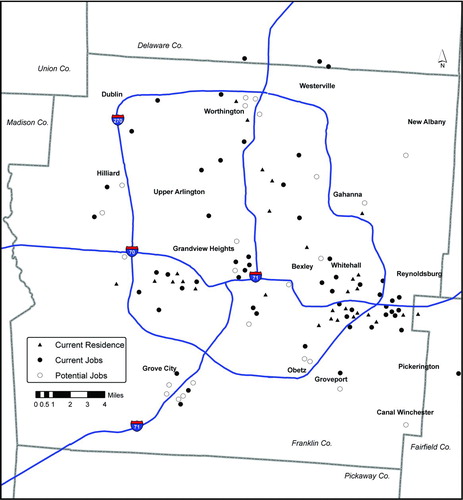
Figure 4 Example of digitized sketch maps for overlay analysis of public space experiences among two lesbian, gay, bisexual, and transgender study informants in St. Louis, Missouri. Subject A (top) and Subject F (bottom). (Color figure available online.)
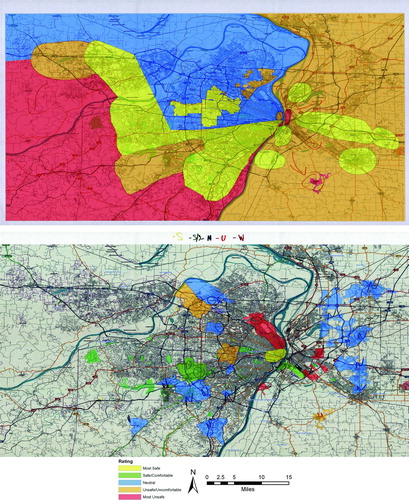
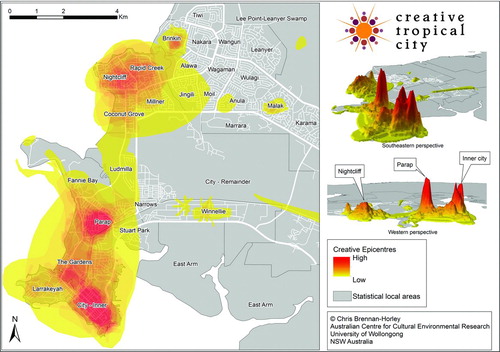
Figure 5 Visualization of the “creative epicenter” in Darwin, Australia, based on sketch map overlays of eighty-three creative workers. Source: Figure adapted by Chris Brennan-Horley, from Brennan-Horley and Gibson (Citation2009). (Color figure available online.)