Figures & data
Figure 1 PM2.5 monitoring device mounted on the roof of the U.S. Embassy in Beijing (Source: Reuters/U.S. Embassy Press Office).
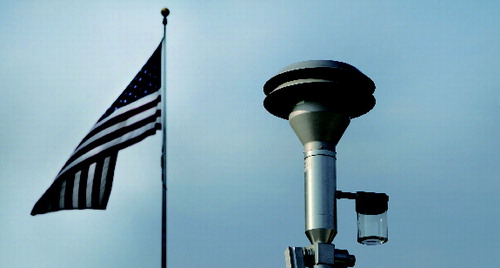
Figure 2 Web crawler procedure for harvesting Sina Weibo data. API = application programming interface.
Table 1 Attributes of the top 20 most influential users
Figure 3 Spatial distribution of the top twenty Sina Weibo users in the air pollution debate measured by weighted in degree, a measure of how influential a user's posts are (generated by Wordle). Note: C = company, G = government; I = individual; N = nongovernmental organizations.
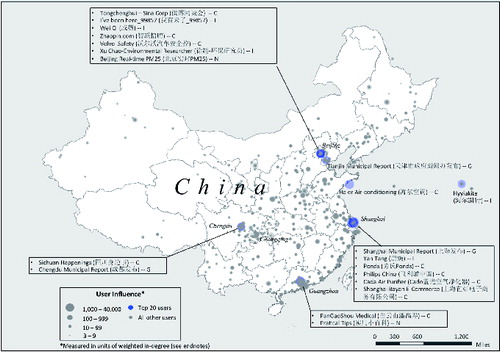
Figure 4 This word cloud shows the top 150 high-frequency terms from our data set generated by Wordle.
Figure 5 A stream graph shows the changing magnitude of number of posts as well as the changing top terms over the time period of our study.
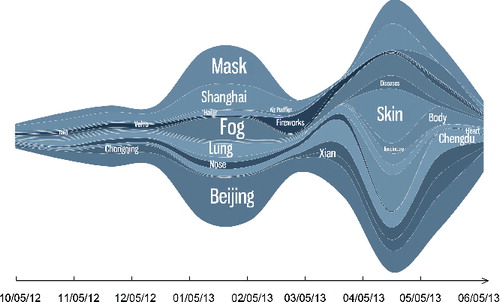
Figure 6 A sample of Pan Shiyi's Weibo posts dated 14 December 2013 showing the composite air quality index (from left to right) of Beijing, Shanghai, and Guangzhou. The official Chinese numbers (top) are juxtaposed with the U.S. Embassy or Consulate readings (bottom) (Source: Sina Weibo).
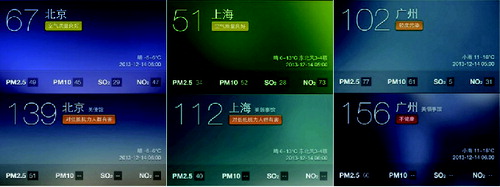
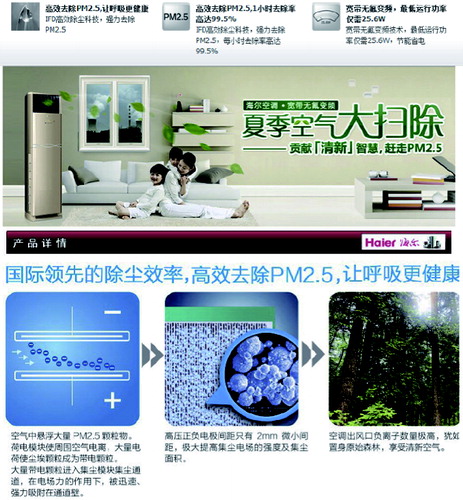
Figure 7 Air filtration system advertisement by Haier on Weibo. (The advertisement states that “using the most advanced technology for the filtration of PM2.5,” Haier's product will enable customers to “breathe healthier air.”) (Source: Sina Weibo).