Figures & data
Table 1 Category measure
Figure 1 Change in the percentage of visitors after the COVID-19 pandemic, compared to a baseline day (the median value from the five-week period between 3 January and 6 February 2020): (A) workplaces; (B) parks and outdoor spaces; (C) public transport stations.
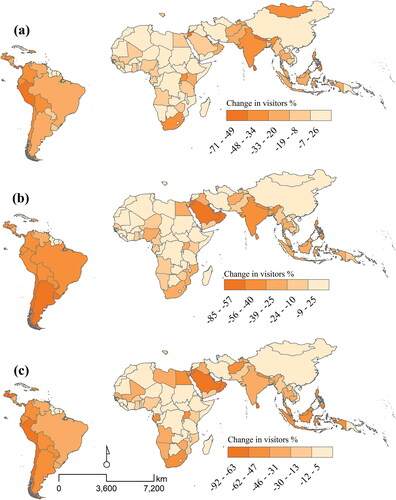
Figure 2 Change in the percentage of visitors and duration spent at home after the COVID-19 pandemic compared to a baseline day (the median value from the five-week period between 3 January and 6 February 2020): (A) change in average duration spent in places of residence; (B) grocery and pharmacy stores; (C) retail and recreation (including restaurants, cafes, shopping centers, theme parks, museums, libraries, and movie theaters).
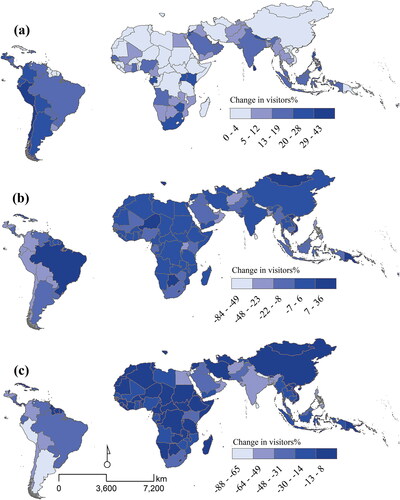
Figure 3 Box plots of the six stringent variables.
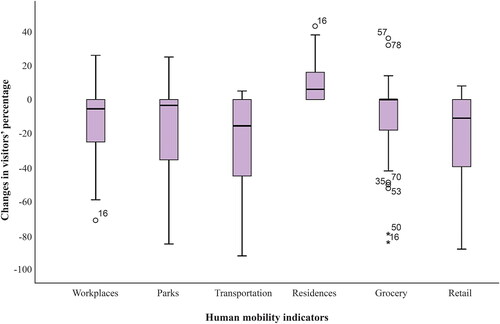
Figure 4 Scatterplots of the relationships between the stringent variables and total cases of COVID-19 in the Global South countries.
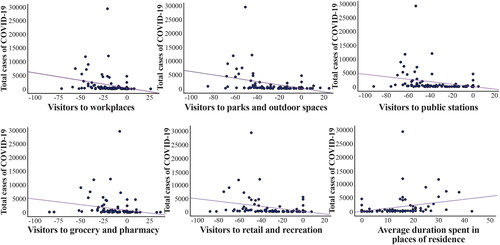
Figure 5 Index of population responses to stringent polices during COVID-19 pandemic in the Global South countries.
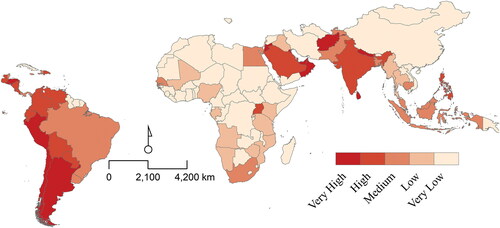
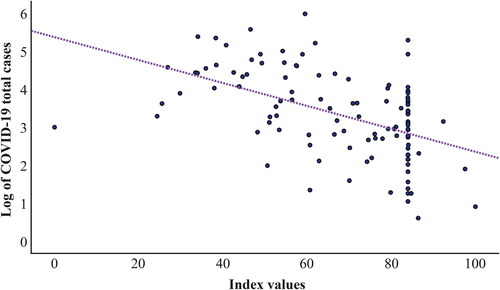
Figure 6 Pearson correlation between the index values and log of total COVID-19 cases in the Global South.