Figures & data
Figure 1 Example of the materials (see https://gis-oer.github.io/gitbook/book/index.html).
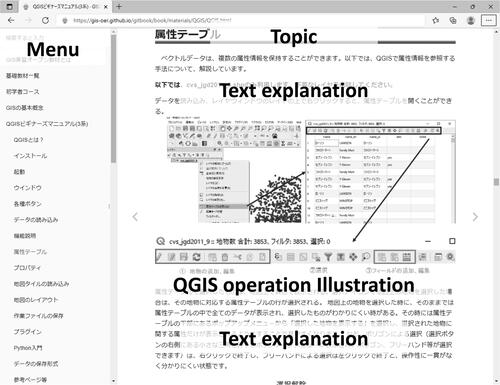
Table 1 Course category and exercise sections of the materials
Table 2 Learning topics in each exercise
Table 3 Improvements to the course and its materials reflecting feedback
Table 4 Number of respondents in each year
Table 5 Questionnaire items and number of answers
Figure 2 Evaluations of the simplicity of the exercises (average = 2.782). Values close to 1 indicate “negative (complex),” and values close to 5 indicate “positive (simple).”
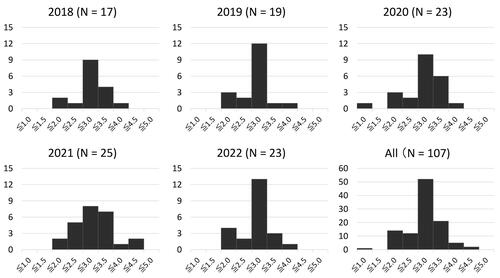
Figure 3 Evaluations of the satisfaction of the exercises (average = 3.917). Values close to 1 indicate “negative,” and values close to 5 indicate “positive.”
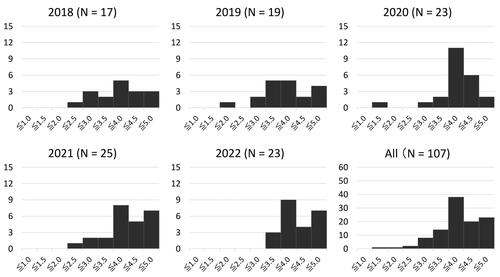
Figure 4 Evaluations of the usability of the materials (average = 3.366). Values close to 1 indicate “negative,” and values close to 5 indicate “positive.”
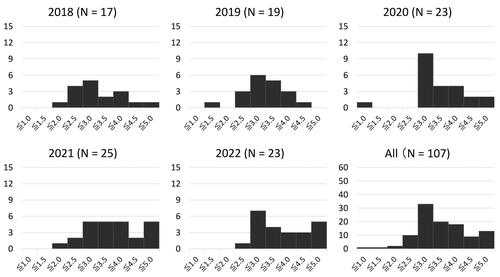
Figure 5 Comparison of the levels of simplicity and satisfaction between online and on-site classes.
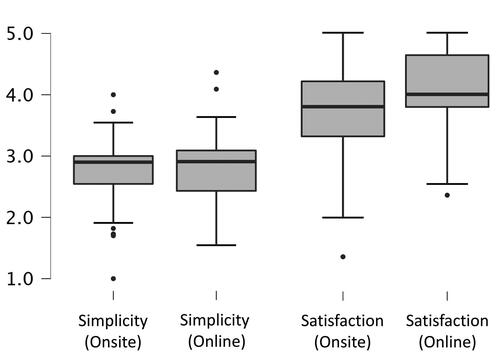
Table 6 Differences in students’ impressions to the exercises and the materials by Kruskal–Wallis test
Table 7 Differences in students’ impressions to onsite class vs online class by Mann-Whitney U test
Figure 6 The answers of questionnaire items (N = 107). Values represented in each bar indicate the number of students.
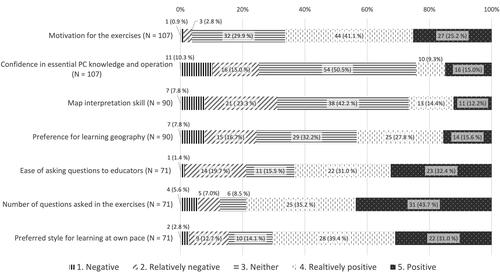
Table 8 Items correlated between Type 1 and Type 2 questions
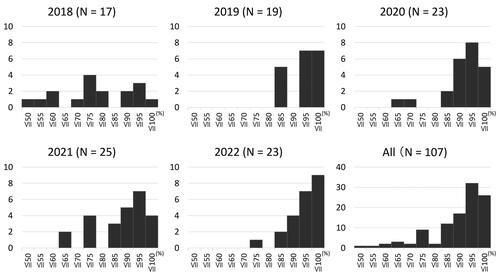
Figure 7 Assignment achievement rate.