
Figures & data
Figure 1. Regional distribution of the entrepreneurial personality profile in Germany.
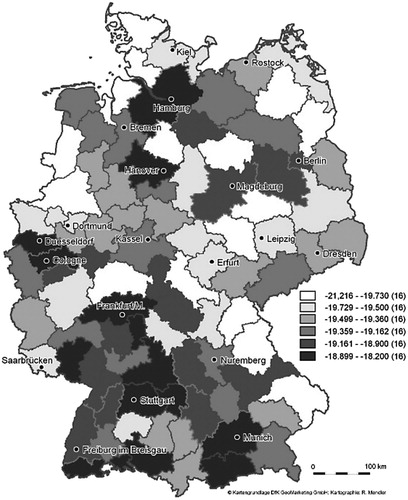
Table 1. Relationship between the self-employment rate (SER) in 1925, the entrepreneurial personality fit of today’s population and current new firm formation (ordinary least squares (OLS) regression).
Table 2. Relationship between the self-employment rate (SER) in 1925, entrepreneurial personality fit and innovation activity today (ordinary least squares (OLS) regressions).
Table 3. Relationship between the self-employment rate (SER) in 1925, the entrepreneurial personality fit of today’s population and start-up rates/innovation activities today: two-stage least squares (2SLS) instrumental variables (IV) regressions (second stage).a
Supplemental material