
Figures & data
Table 1. Main indicators for the analysis of the matrix of technological knowledge flows.
Figure 1. Matrix of cited region (row) x citing region (column) x firm.
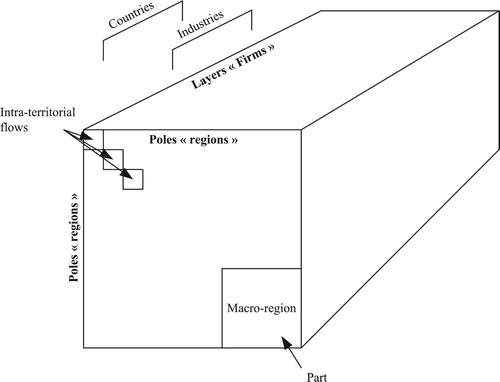
Table 2. Betweenness centrality of regions.
Table 3. Contribution of firms (layers) to regions’ centrality: selected regions (poles).
Supplemental material