
Figures & data
Figure 1. Location of the Cardiff Capital Region (CCR) within both Wales and the UK.
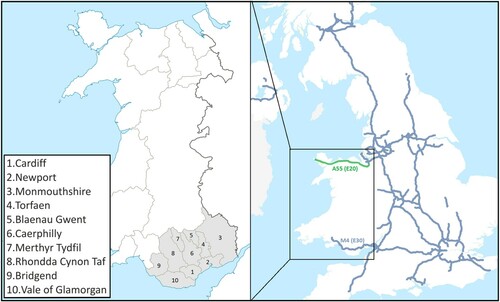
Table 1. QuiScore bands (adapted from FAME QuiScore description).
Table 2. Average QuiScores for active Cardiff Capital Region (CCR) manufacturing companies.
Figure 2. Average QuiScores for active manufacturing companies in the Cardiff Capital Region (CCR) (n = 1785) using Standard Industrial Classification (SIC) manufacturing sectors (two-digit SIC).
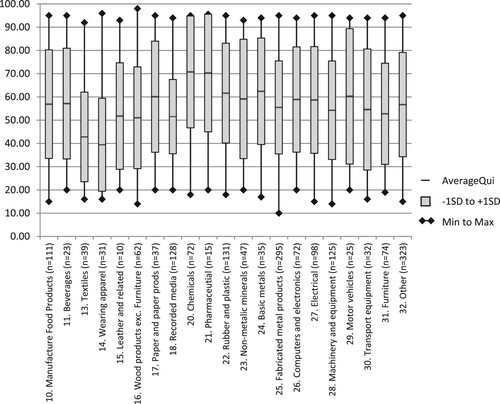
Table 3. Change in QuiScore.
Figure 3. Distribution of companies based on percentage change and QuiScore.
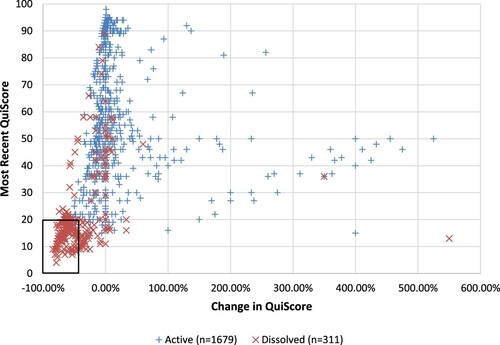
Figure 4. Average annual change in QuiScore for active (n = 994) and dissolved (including in liquidation) companies (n = 132).
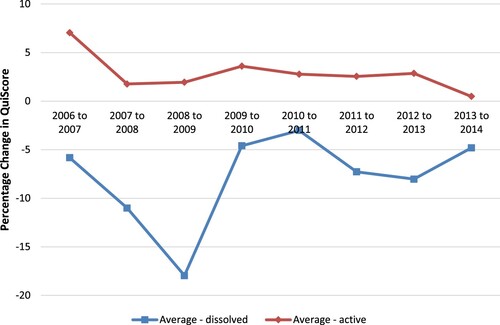
Figure 5. Average annual change in QuiScore for dissolved (including in liquidation) companies based on the final known year of active trading.
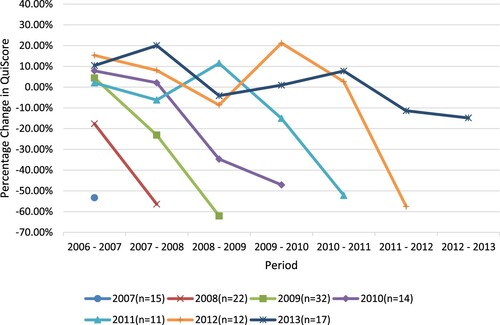
Table 4. Analysis of QuiScore based on RO location.
Table 5. Turnover and trading address analysis.
Table 6. Analysis of companies considered healthy before ceasing to trade.
Supplemental material