
Figures & data
Figure 1. Relegation status by bins of size one.
Note: Average treatment rates in equally sized bins of 1 point are shown. The vertical line represents the difference to the first non-relegation rank.
Source: Author’s own illustration.
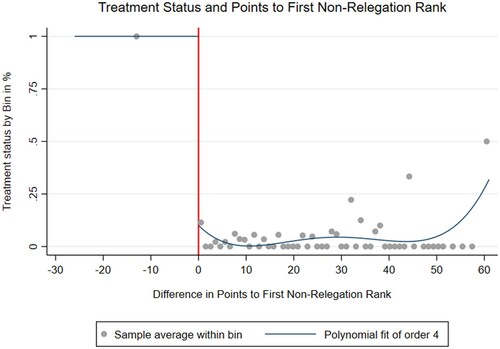
Table 1. Sample properties of pre-relegation characteristics.
Figure 2. Density distribution by difference in points to the first non-relegation rank.
Source: Author’s own illustration.
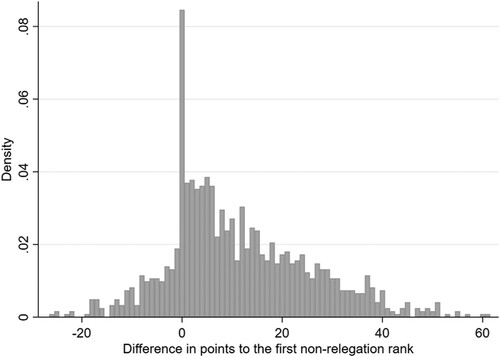
Table 2. Testing for regional differences around the cut-off before treatment.
Figure 3. Regression discontinuity (RD) plots using club-level attendance data as an outcome.
Source: Author’s own illustration.
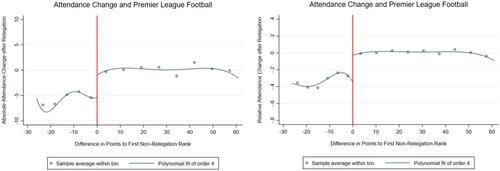
Table 3. Effects of relegation on the demand for live attendance in the stadium.
Table 4. Estimation of the effects of relegation on football-related sectors in the region.
Figure 4. Regression discontinuity (RD) plots using regional sectoral development as an outcome.
Source: Author’s own illustration.
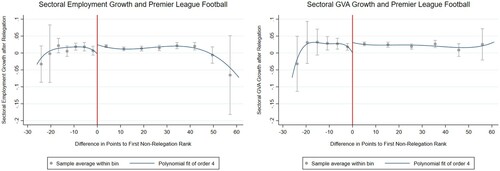
Figure 5. Regression discontinuity (RD) plots using total regional development as an outcome.
Source: Author’s own illustration.
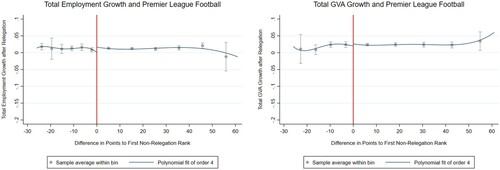
Table 5. Estimation of the effects of relegation on football-related sectors in the region.
Supplemental material