
Figures & data
Figure 1. Territorial pattern of Smart Specialisation projects in Poland.
Source: Authors’ own elaboration.
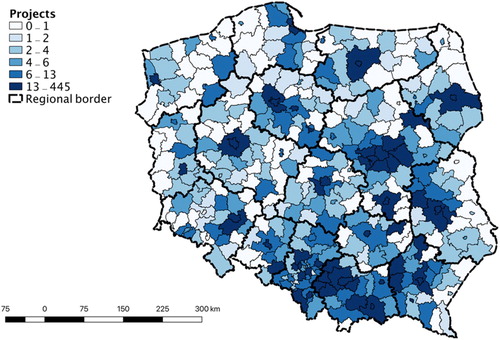
Figure 2. Smart Specialisation location of projects: Moran scatter plot.
Source: Authors’ own elaboration.
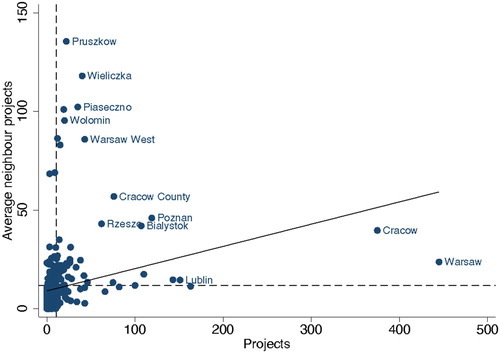
Table 1. Estimation results.
Supplemental material