
Figures & data
Figure 1. Dimensions of regional spatial structure.
Sources: Ouwehand et al. (Citation2020) (adapted from Meijers & Burger, Citation2010).
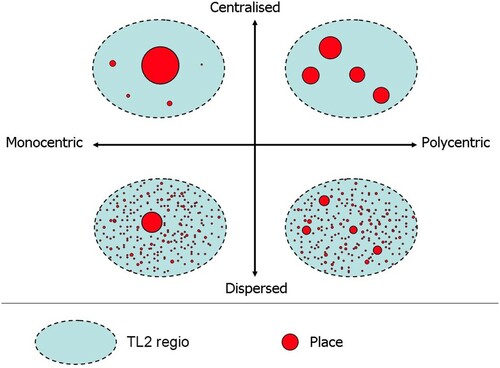
Table 1. Descriptive statistics of main variables included in the study.
Table 2. Multilevel analysis results for the effect of regions’ spatial structure on life satisfaction.
Table 3. Interaction effects between different dimensions of spatial structure and life satisfaction – multilevel analysis.