
Figures & data
Figure 1. Renewable energy cooperatives population in Germany, 2006–16.
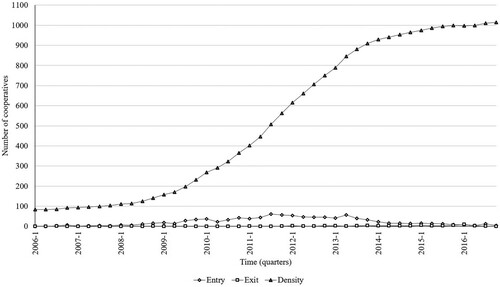
Figure 2. Spatial distribution of renewable energy cooperatives in Germany, 2006–16.
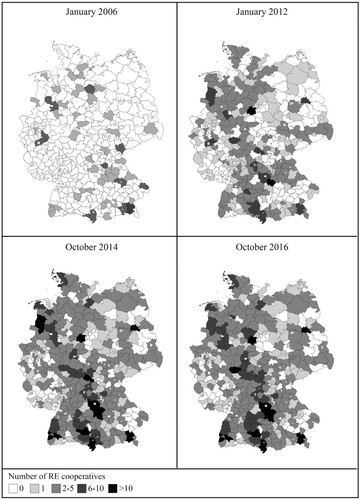
Table 1. Distribution of the foundings of renewable energy (RE) cooperatives over our observations.
Table 2. Descriptive statistics and correlations.
Table 3: Logistic regression models of renewable energy cooperative founding.
Table 4. Logistic regression models of renewable energy cooperative founding separated by renewable energy type.
Supplemental material