Figures & data
Table 1. Industry 4.0 technology (I4T) patent count per period.
Figure 1. Position of Industry 4.0 technologies (I4Ts) in the knowledge space, 2012–16.
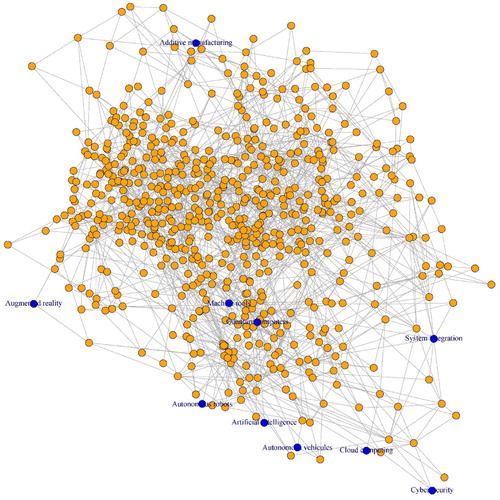
Figure 2. Relatedness between Industry 4.0 technologies (I4Ts).
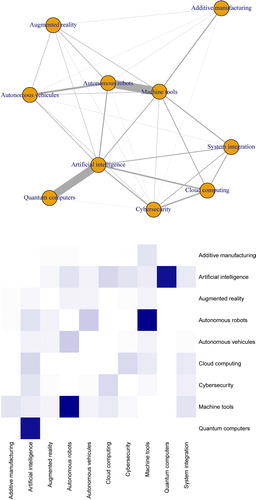
Table 2. Summary statistics.
Table 3. Diversification model (Industry 4.0 technologies – I4Ts).
Figure 3. Relatedness density in Industry 4.0 technology (I4T) across European regions.
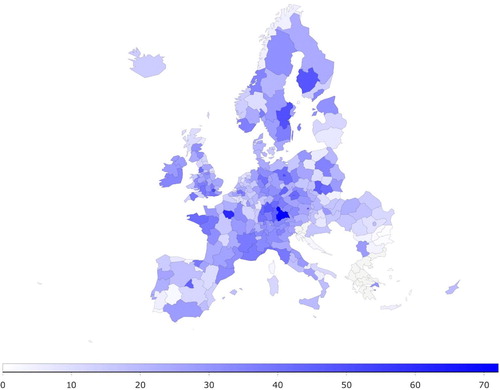
Table 4. Top 20 European Union regions: relatedness density around all Industry 4.0 technologies (I4Ts).a
Figure 4. Relatedness density in autonomous vehicles across European regions.
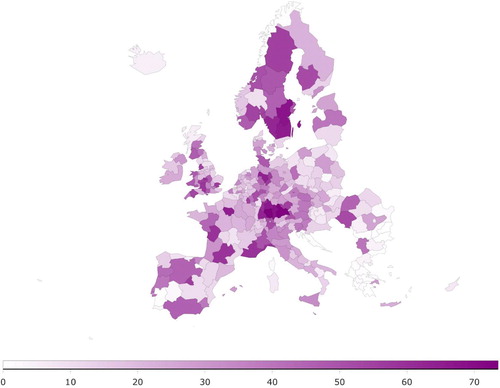
Figure 5. Relatedness density in cybersecurity across European regions.
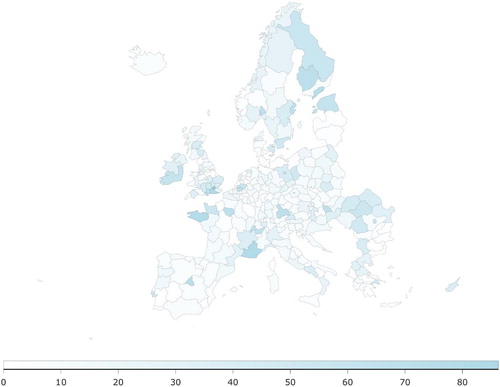
Table 5. Top 10 European regions: relatedness density around each Industry 4.0 technology (I4T).
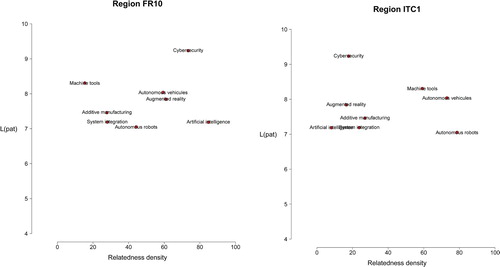
Figure 6. Mapping Industry 4.0 technology (I4T) opportunities of the Île-de-France (FR10) and Piemonte (ITC1).