
Figures & data
Figure 1. Census tracts contributing significant new word tokens in US Patent and Trademark Office (USPTO) trademark descriptions.
Note: Symbol size indicates the number of new tokens contributed (larger indicates more tokens) in three time periods (indicated by the style and colour of the symbols). Identified are the concentrations of innovations in spatial proximity, similar to maps of scientific publications and patents (Balland et al., Citation2020) and of local labour markets using commuter flows (Nelson & Rae, Citation2016). These clusters occur in 10 megaregions (e.g., Northeast, Northern California, Southern California) first identified by Lang and Nelson (Citation2007). Due to classification changes, Nice classes 43–45 are excluded for consistency.
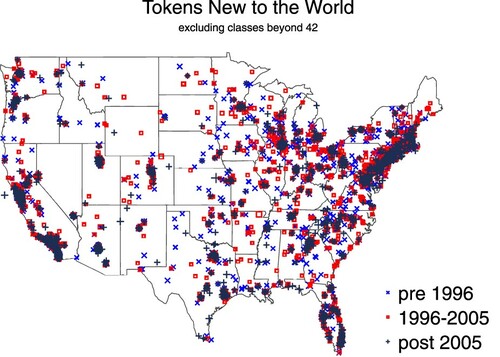
Figure 2. Arrows starting from addresses at which tokens new to the world are introduced and ending at addresses which subsequently use these tokens within the first year of their introduction. We exclude all distances below 100 miles and only show links across which at least five tokens diffused in a given period.
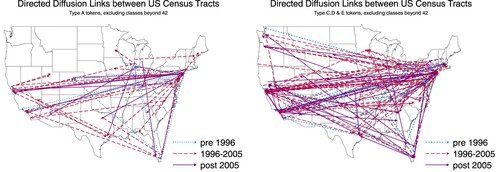
Figure 3. Diffusion of eight innovations captured using token counts from ngram (circles), patent (diamonds) and trademark (plain line) data. The left panel presents data on four innovations associated with high cumulative patent applications; and the right panel presents data on four innovations associated with high cumulative trademark applications.
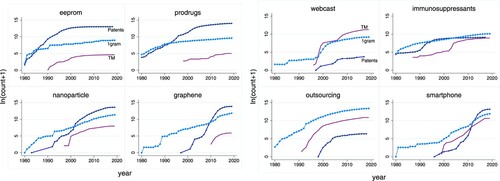
Table 1. Descriptive statistics: type A and B tokens (N = 136,663).
Table 2. First-stage models: first diffusion and net diffusion (N = 136,663).
Table 3. Instrumental variables (IV) Poisson models of innovation diffusion – sample: type A and B tokens (N = 136,663).